Get Data in Pyside6实现一个Graph Digitizer
需求:从图片中提取数据
复现别人的工作进行对比是科研中非常重要的部分:作为参考,验证新方法的方向;作为台阶,验证新方法的效果。 这个时候,我们需要把别人绘制的精巧、漂亮的图片中的数据提取出来,进行分析和对比。
很早以前,我见过用尺子量的,我见过自己随便估计的,我也见过在Matlab中把图片imshow显示出来用ginput函数手动点选做变换的(我不会承认就是我自己),最后大家都会用到一个软件:GetData Graph Digitizer。
很多人用过这个软件,好用,要钱。我也用过,确实好用,能破解,心里不舒服。
GetData Graph Digitizer的功能
GetData Graph Digitizer是一个图形数据提取软件,主要功能包括:
- 从图像中提取数据点
- 支持多种图像格式
- 支持多种坐标系
- 支持自动识别线条
- 支持多种数据格式导出
网上这个软件的破解和帮助都很多,随便搜索就能找到。记得-csdn来避免CSDN锁VIP的烂活。
自己做一个怎么样?
不愿用盗版,感觉非常不符合自己的理念,又不愿意掏钱的时候我们就只能自己动手编一个。
基本的原理
核心算法非常简单:首先找到图片中的坐标轴和刻度,然后根据坐标轴的像素位置建立坐标变换关系,最后就可以将图片中任意一点的像素坐标转换成对应的xy坐标值。
具体步骤如下:
- 识别图片中的坐标轴位置
- 标定坐标轴的刻度值
- 建立像素坐标与实际坐标的映射关系
- 提取曲线上的数据点并进行坐标转换
坐标系的xy坐标系都最少需要标定两个点。
例如,对于x轴从图上确定如下两个点的对应关系:
| 像素位置$x_i$ | 实际坐标$x'_i$ |
|---|---|
| 100 | 0.1 |
| 200 | 10 |
那么就可以确定一个线性关系:
$$ x_\text{actual} = \frac{(x_\text{pixel} - 100)}{(200 - 100)} \times (10-0.1) + 0.1 $$当然,实际上我们会采用更加复杂的最小二乘法来拟合坐标轴的曲线。
$$ \begin{split} &k = \frac{n\sum x_i x'_i - \sum x_i \sum x'_i}{n\sum x_i^2 - (\sum x_i)^2}\\ &b = \frac{\sum x'_i - k\sum x_i}{n} \end{split} $$或者用横线表示平均值,
$$ \overline{x} = \frac{1}{n} \sum_{i=1}^{n} x_i $$前面的最小二乘法公式可以简写为更加专业的形式,并且为了表示这里的斜率和截距式估计值,我们还会再加上一个帽子:
$$ \begin{split} & \hat{k} = \frac{\overline{x \cdot x'} - \overline{x} \cdot \overline{x'}}{\overline{x^2} - \overline{x}^2}\\ & \hat{b} = \overline{x'} - \hat{k} \cdot \overline{x} \end{split} $$其中$n$为数据点个数,$(x_i, x'_i)$为第$i$个标定点的像素坐标和实际坐标对应关系。通过最小二乘法可以得到更加精确的线性变换关系:
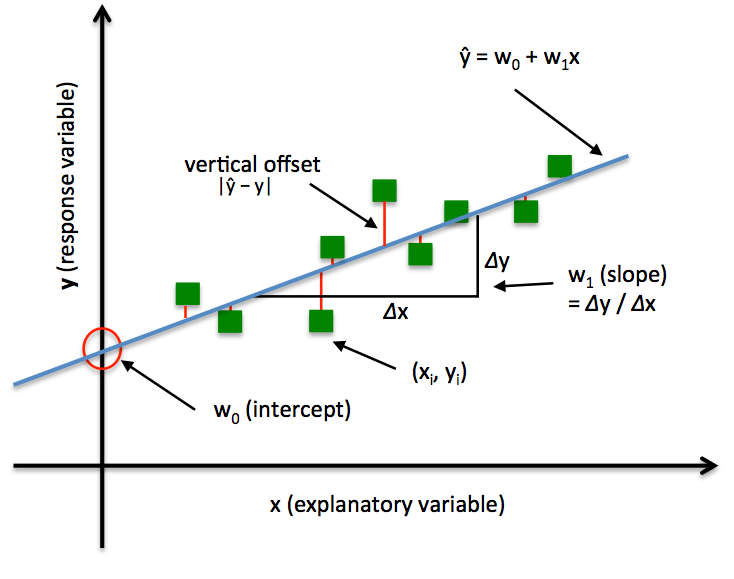
$$x' = \hat{k} \cdot x + \hat{b}$$不要小看这个公式,虽然看起来非常简单,但它在科学研究中应用极其广泛。我从大学时期刚开始接触最小二乘法,一直到博士毕业都在使用,现在工作十几年了,几乎没有一天不用到最小二乘法。当然,用专业的话讲,这叫做线性回归(Linear Regression)。
大概就是下面这个图片显示的内容(本图片没有版权,我本来要自己画一个漂亮的但是没有时间了~~~),大概意思就是这样的。
需求分析
所以从分析需求的角度:
- 数据:
- 图片数据
- 坐标轴标定点的数据表格
- 曲线数据点的坐标
- 输出的数据表格
- 用户交互:
- 打开图片
- 选择坐标点并设定实际值,每个坐标轴至少2个点
- 选择曲线数据点
- 导出数据表格
- 数据交互:
- 图片文件
- 数据文件,拟采用csv格式
通过这个最简单的需求分析,我们就可以开始设计软件的UI和实现代码了。
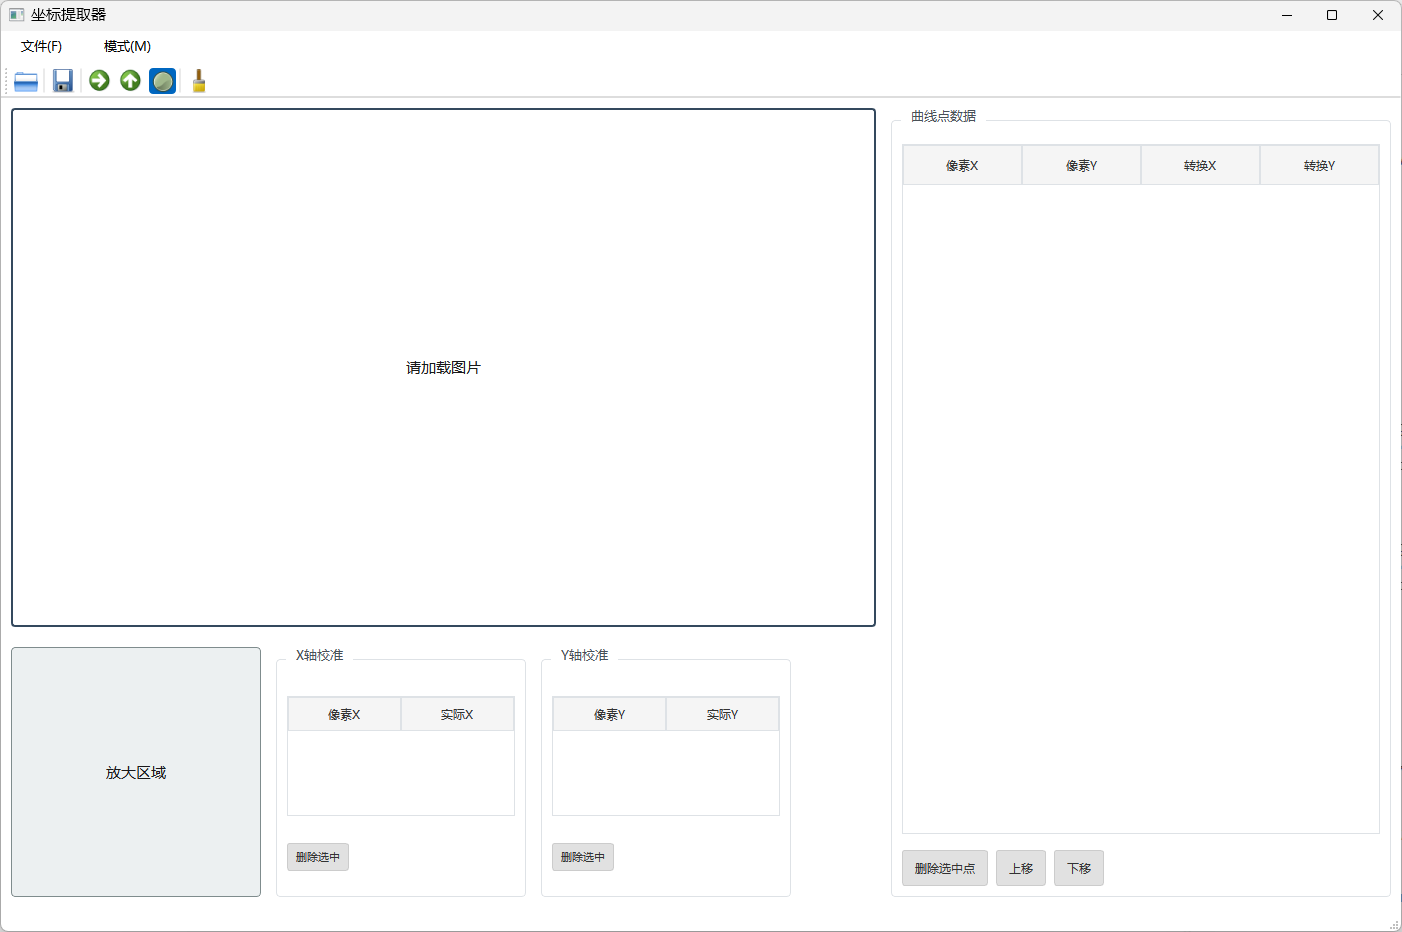
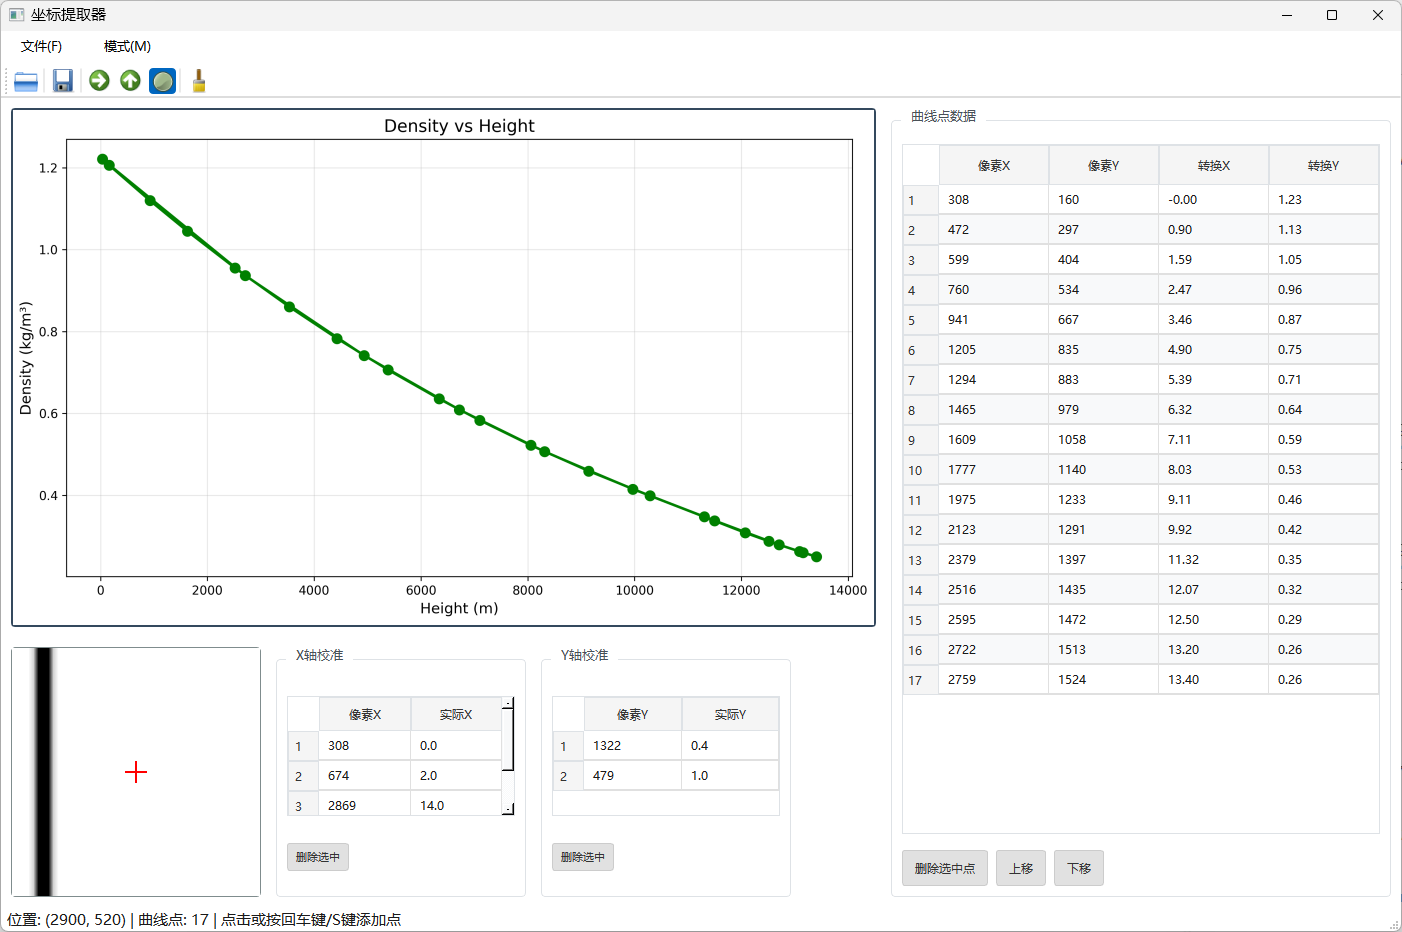
软件的UI/UX
代码实现
一个QLabel处理事件
为什么是QLabel?看下面的类图:
classDiagram
class QWidget
class QFrame
QWidget <|-- QFrame
class QLabel
QFrame <|-- QLabel
class QObject
class QPaintDevice
QPaintDevice <|-- QWidget
QObject <|-- QWidget
如果我们使用QWidget,那么就需要自己处理绘图和事件,这样会比较麻烦。而QLabel已经封装了图片显示和鼠标事件处理,非常方便。
其它可以选择QGraphicsView,但是它的功能过于复杂。
  1class ImageLabel(QLabel):
  2    """
  3    自定义的图片显示标签,专门负责UI事件处理
  4
  5    设计原则(关注点分离):
  6    - UI事件捕获:鼠标点击、移动、键盘按键的原始事件捕获
  7    - 坐标提取:从UI事件中提取位置信息
  8    - 快捷键管理:X/Y/C键切换模式,Enter键采样点
  9    - 事件委托:将处理后的位置信息和操作指令传递给ImageViewer业务层
 10
 11    UI事件处理职责:
 12    - mousePressEvent: 捕获点击并传递像素位置给业务层采样
 13    - mouseMoveEvent: 捕获移动并传递像素位置给业务层更新显示
 14    - keyPressEvent: 处理快捷键并调用业务层对应操作
 15
 16    不负责:
 17    - 业务逻辑处理(如具体的采样、校准逻辑)
 18    - 数据存储和管理
 19    - 坐标转换计算(但会调用业务层的转换方法)
 20    - 放大镜、信息显示等业务UI更新
 21    """
 22
 23    def __init__(self, parent=None):
 24        super().__init__(parent)
 25        self.parent_viewer = parent
 26        # 启用鼠标追踪,即使没有按下鼠标也能跟踪鼠标移动(用于实时放大镜)
 27        self.setMouseTracking(True)
 28
 29    def mousePressEvent(self, event):
 30        """
 31        鼠标按下事件处理(UI层)
 32
 33        职责:
 34        - 捕获鼠标点击事件
 35        - 获取点击位置坐标
 36        - 将位置信息传递给业务层进行采样处理
 37        """
 38        if not self.parent_viewer:
 39            return
 40
 41        # 获取点击位置并转换为图片像素坐标
 42        click_pos = event.position().toPoint()
 43        pixmap_pos = self.parent_viewer.convert_widget_to_pixmap_position(
 44            click_pos)
 45
 46        # 将有效的像素位置传递给业务层处理
 47        if pixmap_pos:
 48            self.parent_viewer.sample_point_at_position(pixmap_pos)
 49
 50    def mouseMoveEvent(self, event):
 51        """
 52        鼠标移动事件处理(UI层)
 53
 54        职责:
 55        - 捕获鼠标移动事件
 56        - 获取鼠标位置坐标
 57        - 将位置信息传递给业务层进行实时反馈更新
 58        """
 59        if not self.parent_viewer:
 60            return
 61
 62        # 获取鼠标位置并转换为图片像素坐标
 63        move_pos = event.position().toPoint()
 64        pixmap_pos = self.parent_viewer.convert_widget_to_pixmap_position(
 65            move_pos)
 66
 67        # 将有效的像素位置传递给业务层更新显示
 68        if pixmap_pos:
 69            self.parent_viewer.update_cursor_tracking_at_position(pixmap_pos)
 70
 71    def keyPressEvent(self, event):
 72        """
 73        键盘按键事件处理(UI层)
 74
 75        快捷键说明:
 76        - X: 切换到X轴校准模式
 77        - Y: 切换到Y轴校准模式
 78        - C: 切换到曲线提取模式
 79        - Enter/Return: 在当前鼠标位置采样点
 80        """
 81        if not self.parent_viewer:
 82            super().keyPressEvent(event)
 83            return
 84
 85        key = event.key()
 86
 87        # 处理模式切换快捷键
 88        if key == Qt.Key_X:
 89            self.parent_viewer.switch_to_mode("x_axis")
 90        elif key == Qt.Key_Y:
 91            self.parent_viewer.switch_to_mode("y_axis")
 92        elif key == Qt.Key_C:
 93            self.parent_viewer.switch_to_mode("curve")
 94        elif key == Qt.Key_Return or key == Qt.Key_Enter or key == Qt.Key_S:
 95            # 获取当前鼠标位置并进行采样
 96            current_pos = self._get_current_mouse_position()
 97            if current_pos:
 98                self.parent_viewer.sample_point_at_position(current_pos)
 99        else:
100            super().keyPressEvent(event)
101
102    def _get_current_mouse_position(self):
103        """获取当前鼠标在图片中的像素位置(UI层方法)"""
104        if not self.parent_viewer or not self.parent_viewer.pixmap:
105            return None
106
107        # 获取鼠标的全局位置并转换为控件相对位置
108        global_pos = QCursor.pos()
109        widget_pos = self.mapFromGlobal(global_pos)
110
111        # 转换为图片像素坐标
112        return self.parent_viewer.convert_widget_to_pixmap_position(widget_pos)
一个QWidget处理业务逻辑
这里的业务逻辑包括:
- 处理图片加载
- 处理图片的局部放大
- 管理坐标轴标定
- 管理曲线数据点
- 处理数据导出
  1class ImageViewer(QWidget):
  2    """
  3    图片查看和业务逻辑处理组件
  4
  5    设计原则(关注点分离):
  6    - 业务逻辑:坐标采样、校准点管理、模式切换的核心逻辑
  7    - 数据管理:校准点和曲线点的存储、转换、计算
  8    - 坐标转换:像素坐标与实际坐标的转换算法
  9    - 显示更新:放大镜、信息显示等业务相关的UI更新
 10
 11    核心功能:
 12    1. 显示图片并支持缩放适应
 13    2. 提供三种交互模式:X轴校准、Y轴校准、曲线提取
 14    3. 实时放大镜显示鼠标周围区域
 15    4. 坐标转换:将像素坐标转换为实际坐标
 16
 17    数据存储:
 18    - x_calibration_points: X轴校准点 [(像素值, 实际值), ...]
 19    - y_calibration_points: Y轴校准点 [(像素值, 实际值), ...]
 20    - curve_points: 曲线点 [(像素x, 像素y), ...]
 21
 22    不负责:
 23    - 原始UI事件处理(由ImageLabel负责)
 24    - 快捷键判断(由ImageLabel负责)
 25    """
 26
 27    def __init__(self):
 28        super().__init__()
 29        self.pixmap = None                    # 原始图片数据
 30        self.current_mode = "curve"           # 当前交互模式
 31        self.x_calibration_points = []       # X轴校准点列表
 32        self.y_calibration_points = []       # Y轴校准点列表
 33        self.curve_points = []               # 曲线点列表
 34        self.curve_table = None              # 曲线点表格(由主窗口设置)
 35        self.main_window = None              # 主窗口引用(由主窗口设置)
 36
 37        self.setup_ui()
 38
 39    def setup_ui(self):
 40        """设置用户界面布局"""
 41        layout = QVBoxLayout()
 42        layout.setContentsMargins(0, 0, 0, 0)  # 移除边距避免重叠
 43        layout.setSpacing(0)  # 移除间距
 44
 45        # 主图片显示区域 - 增大最小尺寸并优化样式
 46        self.image_label = ImageLabel(self)
 47        self.image_label.setMinimumSize(800, 500)  # 增大图片显示区域
 48        self.image_label.setStyleSheet("""
 49            border: 2px solid #34495e;
 50            border-radius: 4px;
 51            background-color: white;
 52        """)
 53        self.image_label.setAlignment(Qt.AlignCenter)
 54        self.image_label.setText("请加载图片")
 55
 56        # 放大镜显示区域
 57        self.zoom_label = QLabel()
 58        # 设置合适的放大镜尺寸
 59        self.zoom_label.setFixedSize(250, 250)
 60        self.zoom_label.setStyleSheet("""
 61            border: 1px solid #7f8c8d;
 62            background-color: #ecf0f1;
 63            border-radius: 4px;
 64        """)
 65        self.zoom_label.setText("放大区域")
 66        self.zoom_label.setAlignment(Qt.AlignCenter)
 67
 68        # 只添加图片标签,放大镜由主窗口管理
 69        layout.addWidget(self.image_label)
 70
 71        self.setLayout(layout)
 72
 73        # 设置图片标签可以接收键盘焦点(用于键盘快捷键)
 74        self.image_label.setFocusPolicy(Qt.StrongFocus)
 75
 76    def load_image(self, image_path):
 77        """Load image from path"""
 78        self.pixmap = QPixmap(image_path)
 79        if not self.pixmap.isNull():
 80            self.update_display()
 81            self.update_status(f"图片已加载: {Path(image_path).name}")
 82            self.image_label.setFocus()
 83        else:
 84            self.update_status("图片加载失败")
 85
 86    def update_display(self):
 87        """Update the image display"""
 88        if self.pixmap:
 89            scaled_pixmap = self.pixmap.scaled(
 90                self.image_label.size(),
 91                Qt.KeepAspectRatio,
 92                Qt.SmoothTransformation
 93            )
 94            self.image_label.setPixmap(scaled_pixmap)
 95
 96    def get_current_mouse_position(self):
 97        """获取当前鼠标位置在图片中的像素坐标(业务层方法)"""
 98        if not self.image_label:
 99            return None
100
101        global_pos = QCursor.pos()
102        widget_pos = self.image_label.mapFromGlobal(global_pos)
103        return self.convert_widget_to_pixmap_position(widget_pos)
104
105    def update_status(self, message):
106        """更新状态栏信息"""
107        if self.main_window and hasattr(self.main_window, 'status_bar'):
108            self.main_window.status_bar.showMessage(message)
109
110    def add_calibration_point(self, axis, pixmap_pos):
111        """
112        添加校准点,用于建立像素坐标与实际坐标的对应关系
113
114        Args:
115            axis: "x" 或 "y",表示校准哪个轴
116            pixmap_pos: 在图片中的像素位置
117        """
118        axis_name = "X轴" if axis == "x" else "Y轴"
119        pixel_val = pixmap_pos.x() if axis == "x" else pixmap_pos.y()
120
121        # 弹出对话框让用户输入该像素位置对应的实际坐标值
122        actual_val, ok = QInputDialog.getDouble(
123            self, f"输入{axis_name}实际值",
124            f"像素{axis_name}={pixel_val}, 请输入对应的实际{axis_name}值:",
125            pixel_val, -1e10, 1e10, 6
126        )
127
128        if ok:
129            # 将校准点添加到相应的校准数据列表中
130            if axis == "x":
131                self.x_calibration_points.append((pixel_val, actual_val))
132                self.update_status(
133                    f"X轴校准点 {len(self.x_calibration_points)} 已添加: 像素X={pixel_val}, 实际X={actual_val}")
134                # 更新校准表格显示
135                if hasattr(self.main_window, 'update_x_calibration_table'):
136                    self.main_window.update_x_calibration_table()
137            else:
138                self.y_calibration_points.append((pixel_val, actual_val))
139                self.update_status(
140                    f"Y轴校准点 {len(self.y_calibration_points)} 已添加: 像素Y={pixel_val}, 实际Y={actual_val}")
141                # 更新校准表格显示
142                if hasattr(self.main_window, 'update_y_calibration_table'):
143                    self.main_window.update_y_calibration_table()
144
145    def switch_to_mode(self, mode):
146        """
147        切换操作模式(业务层方法)
148
149        Args:
150            mode: "x_axis", "y_axis", "curve"
151        """
152        self.set_mode(mode)
153        # 同步更新主窗口的按钮状态
154        if self.main_window:
155            self.main_window.set_mode(mode)
156
157    def convert_widget_to_pixmap_position(self, widget_pos):
158        """
159        将控件坐标转换为原始图片的像素坐标(业务层方法)
160
161        这个方法从UI层的get_pixmap_position重构而来,专注于坐标转换逻辑
162
163        Args:
164            widget_pos: QLabel中的点击位置
165
166        Returns:
167            QPoint: 原始图片中的像素坐标,如果位置无效则返回None
168        """
169        if not self.pixmap:
170            return None
171
172        label_rect = self.image_label.rect()
173        scaled_pixmap = self.image_label.pixmap()
174        if not scaled_pixmap:
175            return None
176
177        # 计算缩放后图片在QLabel中的实际位置(居中显示时的偏移量)
178        x_offset = (label_rect.width() - scaled_pixmap.width()) // 2
179        y_offset = (label_rect.height() - scaled_pixmap.height()) // 2
180
181        # 计算点击位置在缩放图片中的相对坐标
182        scaled_x = widget_pos.x() - x_offset
183        scaled_y = widget_pos.y() - y_offset
184
185        # 检查点击位置是否在缩放图片的有效区域内
186        if (0 <= scaled_x < scaled_pixmap.width() and
187                0 <= scaled_y < scaled_pixmap.height()):
188            # 计算缩放比例,将缩放坐标转换回原始图片坐标
189            scale_x = self.pixmap.width() / scaled_pixmap.width()
190            scale_y = self.pixmap.height() / scaled_pixmap.height()
191
192            original_x = int(scaled_x * scale_x)
193            original_y = int(scaled_y * scale_y)
194
195            return QPoint(original_x, original_y)
196        return None
197
198    def update_cursor_tracking_at_position(self, pixmap_pos):
199        """
200        在指定像素位置更新光标跟踪和实时反馈显示(业务层方法)
201
202        Args:
203            pixmap_pos: QPoint对象,图片中的像素位置
204        """
205        self.update_zoom_area(pixmap_pos)
206        self.update_info(pixmap_pos)
207
208    def sample_point_at_position(self, position):
209        """
210        在指定位置采样点(业务核心方法)
211
212        根据当前模式决定具体的采样行为:
213        - X轴校准模式:添加X轴校准点
214        - Y轴校准模式:添加Y轴校准点
215        - 曲线提取模式:添加曲线点
216
217        Args:
218            position: QPoint对象,图片中的像素位置
219        """
220        if self.current_mode == "x_axis":
221            self.add_calibration_point("x", position)
222        elif self.current_mode == "y_axis":
223            self.add_calibration_point("y", position)
224        elif self.current_mode == "curve":
225            self.add_curve_point(position)
226
227    def update_zoom_area(self, pos):
228        """
229        更新放大镜区域显示
230
231        在鼠标位置周围创建一个放大视图,帮助用户精确定位点击位置
232        """
233        if not self.pixmap:
234            return
235
236        # 定义放大区域的大小(像素)
237        zoom_size = 50
238        x, y = pos.x(), pos.y()
239
240        # 从原始图片中提取鼠标周围的区域
241        zoom_rect = QRect(x - zoom_size//2, y - zoom_size //
242                          2, zoom_size, zoom_size)
243        # 确保放大区域不超出图片边界
244        zoom_rect = zoom_rect.intersected(self.pixmap.rect())
245
246        if zoom_rect.isValid():
247            # 复制放大区域的图片内容
248            zoom_pixmap = self.pixmap.copy(zoom_rect)
249
250            # 将放大区域缩放到放大镜显示区域的大小,使用IgnoreAspectRatio确保完全填充
251            scaled_zoom = zoom_pixmap.scaled(
252                self.zoom_label.size(),
253                Qt.IgnoreAspectRatio,  # 忽略宽高比,完全填充显示区域
254                Qt.SmoothTransformation
255            )
256
257            # 在放大视图的中心绘制十字准线,指示精确位置
258            center_x = scaled_zoom.width() // 2
259            center_y = scaled_zoom.height() // 2
260
261            painter = QPainter(scaled_zoom)
262            painter.setPen(QPen(QColor(255, 0, 0), 2))  # 红色,2像素宽
263            # 绘制水平线
264            painter.drawLine(center_x - 10, center_y, center_x + 10, center_y)
265            # 绘制垂直线
266            painter.drawLine(center_x, center_y - 10, center_x, center_y + 10)
267            painter.end()
268
269            self.zoom_label.setPixmap(scaled_zoom)
270        else:
271            # 如果无法创建有效的放大区域,清空放大镜显示
272            self.zoom_label.setPixmap(QPixmap())
273
274    def update_info(self, pos):
275        """Update information display"""
276        info_text = f"位置: ({pos.x()}, {pos.y()})"
277
278        if self.current_mode == "x_axis":
279            info_text += f" | X轴校准点: {len(self.x_calibration_points)}"
280        elif self.current_mode == "y_axis":
281            info_text += f" | Y轴校准点: {len(self.y_calibration_points)}"
282        elif self.current_mode == "curve":
283            info_text += f" | 曲线点: {len(self.curve_points)} | 点击或按回车键/S键添加点"
284
285        self.update_status(info_text)
286
287    def add_curve_point(self, pos):
288        """Add curve point"""
289        self.curve_points.append((pos.x(), pos.y()))
290        self.update_status(
291            f"曲线点 {len(self.curve_points)} 已添加: ({pos.x()}, {pos.y()})")
292
293        if self.curve_table:
294            self.update_curve_table()
295
296    def update_curve_table(self):
297        """更新曲线点数据表格,包含像素坐标和转换后的实际坐标"""
298        if not self.curve_table:
299            return
300
301        self.curve_table.setRowCount(len(self.curve_points))
302
303        for i, (pixel_x, pixel_y) in enumerate(self.curve_points):
304            # 填充像素坐标到表格
305            self.curve_table.setItem(i, 0, QTableWidgetItem(str(pixel_x)))
306            self.curve_table.setItem(i, 1, QTableWidgetItem(str(pixel_y)))
307
308            # 初始化转换坐标为像素坐标(如果没有校准数据)
309            transformed_x = pixel_x
310            transformed_y = pixel_y
311
312            # 尝试获取校准数据进行坐标转换
313            if hasattr(self.main_window, 'get_calibration_data'):
314                x_calibration = self.main_window.get_calibration_data(
315                    self.main_window.x_calibration_table)
316                y_calibration = self.main_window.get_calibration_data(
317                    self.main_window.y_calibration_table)
318
319                # 如果X轴和Y轴校准数据都存在,进行坐标转换
320                if x_calibration and y_calibration:
321                    transformed_coords = self._transform_single_point(
322                        pixel_x, pixel_y, x_calibration, y_calibration)
323                    if transformed_coords:
324                        transformed_x, transformed_y = transformed_coords
325
326            # 填充转换后的坐标到表格(保留2位小数)
327            self.curve_table.setItem(
328                i, 2, QTableWidgetItem(f"{transformed_x:.2f}"))
329            self.curve_table.setItem(
330                i, 3, QTableWidgetItem(f"{transformed_y:.2f}"))
331
332    def _transform_single_point(self, pixel_x, pixel_y, x_calibration, y_calibration):
333        """
334        使用最小二乘法将单个像素点转换为实际坐标
335
336        Args:
337            pixel_x, pixel_y: 像素坐标
338            x_calibration: X轴校准数据 [(像素值, 实际值), ...]
339            y_calibration: Y轴校准数据 [(像素值, 实际值), ...]
340
341        Returns:
342            (transformed_x, transformed_y) 或 None(如果校准数据不足)
343        """
344        try:
345            # 提取像素坐标和实际坐标
346            x_pixels = [p[0] for p in x_calibration]
347            y_pixels = [p[0] for p in y_calibration]
348            x_actuals = [p[1] for p in x_calibration]
349            y_actuals = [p[1] for p in y_calibration]
350
351            # 检查校准点数量是否足够(至少需要2个点才能进行线性拟合)
352            if len(x_pixels) >= 2 and len(y_pixels) >= 2:
353                # 使用最小二乘法拟合X轴线性变换:actual_x = k_x * pixel_x + b_x
354                A_x = np.vstack([x_pixels, np.ones(len(x_pixels))]).T
355                k_x, b_x = np.linalg.lstsq(A_x, x_actuals, rcond=None)[0]
356                transformed_x = k_x * pixel_x + b_x
357
358                # 使用最小二乘法拟合Y轴线性变换:actual_y = k_y * pixel_y + b_y
359                A_y = np.vstack([y_pixels, np.ones(len(y_pixels))]).T
360                k_y, b_y = np.linalg.lstsq(A_y, y_actuals, rcond=None)[0]
361                transformed_y = k_y * pixel_y + b_y
362
363                return (transformed_x, transformed_y)
364        except Exception:
365            # 如果转换过程中出现任何错误,返回None
366            pass
367
368        return None
369
370    def clear_points(self):
371        """Clear all points"""
372        self.x_calibration_points.clear()
373        self.y_calibration_points.clear()
374        self.curve_points.clear()
375        self.update_status("所有点已清除")
376
377        # 更新曲线表格显示
378        if self.curve_table:
379            self.update_curve_table()
380
381    def set_mode(self, mode):
382        """Set the current interaction mode"""
383        self.current_mode = mode
384        mode_names = {
385            "x_axis": "X轴校准",
386            "y_axis": "Y轴校准",
387            "curve": "曲线提取"
388        }
389        self.update_status(f"模式: {mode_names.get(mode, mode)}")
390
391        # Set cursor based on mode
392        if mode in ["x_axis", "y_axis"]:
393            self.image_label.setCursor(QCursor(Qt.CrossCursor))
394        else:
395            self.image_label.setCursor(QCursor(Qt.ArrowCursor))
396
397        # Ensure keyboard focus is set to image label
398        self.image_label.setFocus()
一个QMainWindow管理界面布局
1class CoordinateExtractorApp(QMainWindow):
2 """Main application window"""
3
4 def __init__(self):
5 super().__init__()
6 self.setWindowTitle("坐标提取器")
7
8 # 设置更合理的初始窗口大小和最小尺寸
9 self.setGeometry(100, 100, 1400, 900) # 增大初始窗口
10 self.setMinimumSize(1200, 700) # 设置最小窗口尺寸确保可用性
11
12 # 设置窗口图标和样式优化
13 self.setStyleSheet("""
14 QMainWindow {
15 background-color: #ffffff;
16 }
17 QGroupBox {
18 font-size: 10pt;
19 border: 1px solid #dee2e6;
20 margin-top: 12px;
21 padding-top: 8px;
22 border-radius: 4px;
23 }
24 QGroupBox::title {
25 subcontrol-origin: margin;
26 left: 10px;
27 padding: 0 8px 0 8px;
28 color: #495057;
29 font-weight: bold;
30 background-color: white;
31 }
32 QPushButton {
33 background-color: #e1e1e1;
34 border: 1px solid #cccccc;
35 color: #333333;
36 padding: 8px 12px;
37 font-size: 9pt;
38 min-height: 18px;
39 text-align: center;
40 border-radius: 3px;
41 }
42 QPushButton:hover {
43 background-color: #d4d4d4;
44 border-color: #b8b8b8;
45 }
46 QPushButton:pressed {
47 background-color: #c8c8c8;
48 border-color: #adadad;
49 }
50 """)
51
52 # Initialize components
53 self.image_viewer = ImageViewer()
54 self.image_viewer.main_window = self # Set reference to main window
55
56 # 创建状态栏
57 self.status_bar = self.statusBar()
58 self.status_bar.showMessage("信息: 请选择模式并加载图片")
59
60 self.setup_ui()
61
62 # Connect curve table to image viewer
63 self.image_viewer.curve_table = self.curve_table
64
65 # 设置默认模式为曲线提取(程序的主要功能)
66 self.set_mode("curve")
67
68 def setup_ui(self):
69 """Setup the user interface"""
70 # 创建菜单栏
71 self.create_menu_bar()
72
73 # 创建工具栏
74 self.create_tool_bar()
75
76 central_widget = QWidget()
77 self.setCentralWidget(central_widget)
78
79 # 主布局:水平布局,左侧图片+校准区域,右侧曲线数据
80 main_layout = QHBoxLayout()
81 main_layout.setContentsMargins(10, 10, 10, 10)
82 main_layout.setSpacing(15)
83
84 # 左侧:图片和校准区域
85 left_layout = QVBoxLayout()
86 left_layout.setSpacing(10)
87
88 # 图片显示区域
89 left_layout.addWidget(self.image_viewer.image_label, 1)
90
91 # 底部:放大镜 + X校准 + Y校准 (横排)
92 bottom_layout = QHBoxLayout()
93 bottom_layout.setSpacing(15)
94 bottom_layout.setContentsMargins(0, 10, 0, 0) # 增加顶部边距
95
96 # 放大镜
97 bottom_layout.addWidget(self.image_viewer.zoom_label)
98
99 # X校准表格
100 x_cal_group = self.create_x_calibration_group()
101 x_cal_group.setMaximumWidth(250)
102 x_cal_group.setMinimumHeight(200) # 设置最小高度
103 x_cal_group.setMaximumHeight(300) # 设置最大高度
104 bottom_layout.addWidget(x_cal_group)
105
106 # Y校准表格
107 y_cal_group = self.create_y_calibration_group()
108 y_cal_group.setMaximumWidth(250)
109 y_cal_group.setMinimumHeight(200) # 设置最小高度
110 y_cal_group.setMaximumHeight(300) # 设置最大高度
111 bottom_layout.addWidget(y_cal_group)
112
113 bottom_layout.addStretch() # 添加弹性空间
114
115 left_layout.addLayout(bottom_layout)
116
117 main_layout.addLayout(left_layout, 3) # 左侧占3份空间
118
119 # 右侧:曲线数据面板(独立一栏)
120 curve_group = self.create_curve_group()
121 curve_group.setMinimumWidth(400)
122 curve_group.setMaximumWidth(500)
123 main_layout.addWidget(curve_group, 2) # 右侧占2份空间
124
125 central_widget.setLayout(main_layout)
126
127 def create_tool_bar(self):
128 """创建工具栏"""
129 toolbar = self.addToolBar('工具栏')
130 toolbar.setToolButtonStyle(Qt.ToolButtonIconOnly) # 只显示图标
131
132 # 加载图片
133 load_action = QAction(self)
134 load_action.setIcon(self.style().standardIcon(
135 self.style().StandardPixmap.SP_DirOpenIcon))
136 load_action.setToolTip('加载图片文件')
137 load_action.setStatusTip('加载图片文件')
138 load_action.triggered.connect(self.load_image)
139 toolbar.addAction(load_action)
140
141 toolbar.addSeparator()
142
143 # 保存CSV
144 save_action = QAction(self)
145 save_action.setIcon(self.style().standardIcon(
146 self.style().StandardPixmap.SP_DialogSaveButton))
147 save_action.setToolTip('保存CSV文件')
148 save_action.setStatusTip('保存提取的数据到CSV文件')
149 save_action.triggered.connect(self.save_csv)
150 toolbar.addAction(save_action)
151
152 toolbar.addSeparator()
153
154 # X轴校准模式
155 x_axis_action = QAction(self)
156 x_axis_action.setIcon(self.style().standardIcon(
157 self.style().StandardPixmap.SP_ArrowRight))
158 x_axis_action.setToolTip('X轴校准模式')
159 x_axis_action.setStatusTip('切换到X轴校准模式')
160 x_axis_action.setCheckable(True) # 设置为可选中状态
161 x_axis_action.triggered.connect(lambda: self.set_mode("x_axis"))
162 toolbar.addAction(x_axis_action)
163 self.x_axis_toolbar_action = x_axis_action
164
165 # Y轴校准模式
166 y_axis_action = QAction(self)
167 y_axis_action.setIcon(self.style().standardIcon(
168 self.style().StandardPixmap.SP_ArrowUp))
169 y_axis_action.setToolTip('Y轴校准模式')
170 y_axis_action.setStatusTip('切换到Y轴校准模式')
171 y_axis_action.setCheckable(True) # 设置为可选中状态
172 y_axis_action.triggered.connect(lambda: self.set_mode("y_axis"))
173 toolbar.addAction(y_axis_action)
174 self.y_axis_toolbar_action = y_axis_action
175
176 # 曲线提取模式
177 curve_action = QAction(self)
178 curve_action.setIcon(self.style().standardIcon(
179 self.style().StandardPixmap.SP_DialogYesButton))
180 curve_action.setToolTip('曲线提取模式')
181 curve_action.setStatusTip('切换到曲线提取模式')
182 curve_action.setCheckable(True) # 设置为可选中状态
183 curve_action.triggered.connect(lambda: self.set_mode("curve"))
184 toolbar.addAction(curve_action)
185 self.curve_toolbar_action = curve_action
186
187 toolbar.addSeparator()
188
189 # 清除所有点
190 clear_action = QAction(self)
191 clear_action.setIcon(self.style().standardIcon(
192 self.style().StandardPixmap.SP_DialogResetButton))
193 clear_action.setToolTip('清除所有点')
194 clear_action.setStatusTip('清除所有校准点和曲线点')
195 clear_action.triggered.connect(self.clear_points)
196 toolbar.addAction(clear_action)
197
198 def create_menu_bar(self):
199 """创建菜单栏"""
200 menubar = self.menuBar()
201
202 # 文件菜单
203 file_menu = menubar.addMenu('文件(&F)')
204
205 # 加载图片
206 load_action = QAction('加载图片(&O)', self)
207 load_action.setShortcut('Ctrl+O')
208 load_action.setStatusTip('加载图片文件')
209 load_action.triggered.connect(self.load_image)
210 file_menu.addAction(load_action)
211
212 file_menu.addSeparator()
213
214 # 保存CSV
215 save_action = QAction('保存CSV(&S)', self)
216 save_action.setShortcut('Ctrl+S')
217 save_action.setStatusTip('保存提取的数据到CSV文件')
218 save_action.triggered.connect(self.save_csv)
219 file_menu.addAction(save_action)
220
221 file_menu.addSeparator()
222
223 # 退出
224 exit_action = QAction('退出(&X)', self)
225 exit_action.setShortcut('Ctrl+Q')
226 exit_action.setStatusTip('退出应用程序')
227 exit_action.triggered.connect(self.close)
228 file_menu.addAction(exit_action)
229
230 # 模式菜单
231 mode_menu = menubar.addMenu('模式(&M)')
232
233 # X轴校准模式
234 x_axis_action = QAction('X轴校准(&X)', self)
235 x_axis_action.setShortcut('X')
236 x_axis_action.setStatusTip('切换到X轴校准模式')
237 x_axis_action.triggered.connect(lambda: self.set_mode("x_axis"))
238 mode_menu.addAction(x_axis_action)
239 self.x_axis_action = x_axis_action
240
241 # Y轴校准模式
242 y_axis_action = QAction('Y轴校准(&Y)', self)
243 y_axis_action.setShortcut('Y')
244 y_axis_action.setStatusTip('切换到Y轴校准模式')
245 y_axis_action.triggered.connect(lambda: self.set_mode("y_axis"))
246 mode_menu.addAction(y_axis_action)
247 self.y_axis_action = y_axis_action
248
249 # 曲线提取模式
250 curve_action = QAction('曲线提取(&C)', self)
251 curve_action.setShortcut('C')
252 curve_action.setStatusTip('切换到曲线提取模式')
253 curve_action.triggered.connect(lambda: self.set_mode("curve"))
254 mode_menu.addAction(curve_action)
255 self.curve_action = curve_action
256
257 mode_menu.addSeparator()
258
259 # 清除所有点
260 clear_action = QAction('清除所有点(&R)', self)
261 clear_action.setShortcut('Ctrl+R')
262 clear_action.setStatusTip('清除所有校准点和曲线点')
263 clear_action.triggered.connect(self.clear_points)
264 mode_menu.addAction(clear_action)
265
266 def create_x_calibration_group(self):
267 """Create X calibration group"""
268 x_cal_group = QGroupBox("X轴校准")
269 x_cal_layout = QVBoxLayout()
270 x_cal_layout.setContentsMargins(10, 15, 10, 10)
271 x_cal_layout.setSpacing(8)
272
273 # X轴校准表格
274 self.x_calibration_table = self.create_calibration_table([
275 "像素X", "实际X"])
276 self.x_calibration_table.setMinimumHeight(80)
277 self.x_calibration_table.setMaximumHeight(120)
278 x_cal_layout.addWidget(self.x_calibration_table)
279
280 # X轴校准控制按钮
281 x_cal_btn_layout = QHBoxLayout()
282 x_cal_btn_layout.setContentsMargins(0, 6, 0, 0)
283 x_cal_btn_layout.setSpacing(5)
284
285 self.delete_x_cal_btn = QPushButton("删除选中")
286 self.delete_x_cal_btn.clicked.connect(
287 self.delete_selected_x_calibration)
288 self.delete_x_cal_btn.setStyleSheet(
289 "font-size: 8pt; padding: 4px 8px;")
290 x_cal_btn_layout.addWidget(self.delete_x_cal_btn)
291 x_cal_btn_layout.addStretch()
292
293 x_cal_layout.addLayout(x_cal_btn_layout)
294 x_cal_group.setLayout(x_cal_layout)
295 return x_cal_group
296
297 def create_y_calibration_group(self):
298 """Create Y calibration group"""
299 y_cal_group = QGroupBox("Y轴校准")
300 y_cal_layout = QVBoxLayout()
301 y_cal_layout.setContentsMargins(10, 15, 10, 10)
302 y_cal_layout.setSpacing(8)
303
304 # Y轴校准表格
305 self.y_calibration_table = self.create_calibration_table([
306 "像素Y", "实际Y"])
307 self.y_calibration_table.setMinimumHeight(80)
308 self.y_calibration_table.setMaximumHeight(120)
309 y_cal_layout.addWidget(self.y_calibration_table)
310
311 # Y轴校准控制按钮
312 y_cal_btn_layout = QHBoxLayout()
313 y_cal_btn_layout.setContentsMargins(0, 6, 0, 0)
314 y_cal_btn_layout.setSpacing(5)
315
316 self.delete_y_cal_btn = QPushButton("删除选中")
317 self.delete_y_cal_btn.clicked.connect(
318 self.delete_selected_y_calibration)
319 self.delete_y_cal_btn.setStyleSheet(
320 "font-size: 8pt; padding: 4px 8px;")
321 y_cal_btn_layout.addWidget(self.delete_y_cal_btn)
322 y_cal_btn_layout.addStretch()
323
324 y_cal_layout.addLayout(y_cal_btn_layout)
325 y_cal_group.setLayout(y_cal_layout)
326 return y_cal_group
327
328 def create_calibration_table(self, headers):
329 """Create a calibration table with given headers"""
330 table = QTableWidget()
331 table.setColumnCount(2)
332 table.setHorizontalHeaderLabels(headers)
333 table.horizontalHeader().setSectionResizeMode(QHeaderView.Stretch)
334 table.setEditTriggers(QTableWidget.DoubleClicked |
335 QTableWidget.SelectedClicked)
336
337 # 优化校准表格的高度设置 - 确保内容可见且不会过大
338 table.setMinimumHeight(80)
339 table.setMaximumHeight(120)
340 table.setSizeAdjustPolicy(QTableWidget.AdjustToContents)
341 table.setVerticalScrollBarPolicy(Qt.ScrollBarAsNeeded)
342 table.setHorizontalScrollBarPolicy(Qt.ScrollBarAlwaysOff)
343
344 table.setStyleSheet("""
345 QTableWidget {
346 border: 1px solid #dee2e6;
347 background-color: white;
348 gridline-color: #e0e0e0;
349 font-size: 9pt;
350 selection-background-color: #0078d4;
351 selection-color: white;
352 }
353 QTableWidget::item {
354 padding: 4px 6px;
355 border-bottom: 1px solid #e0e0e0;
356 min-height: 20px;
357 }
358 QTableWidget::item:selected {
359 background-color: #0078d4;
360 color: white;
361 }
362 QHeaderView::section {
363 background-color: #f5f5f5;
364 color: #333333;
365 padding: 4px 6px;
366 border: 1px solid #dee2e6;
367 font-size: 9pt;
368 min-height: 24px;
369 font-weight: normal;
370 }
371 QScrollBar:vertical {
372 width: 12px;
373 background-color: #f8f9fa;
374 }
375 """)
376
377 # 连接表格内容变化信号,当用户编辑校准数据时自动更新曲线点转换坐标
378 table.itemChanged.connect(self.on_calibration_table_changed)
379
380 return table
381
382 def on_calibration_table_changed(self, item):
383 """
384 处理校准表格内容变化事件
385
386 当用户编辑校准表格中的数值时,自动更新相应的校准数据并重新计算曲线点的转换坐标
387
388 Args:
389 item: 被修改的表格项
390 """
391 if not item:
392 return
393
394 table = item.tableWidget()
395 if not table:
396 return
397
398 try:
399 # 验证输入数据的有效性
400 if item.column() == 0: # 像素值列
401 pixel_val = int(item.text())
402 else: # 实际值列
403 actual_val = float(item.text())
404
405 # 确定是X轴还是Y轴校准表格
406 if table == self.x_calibration_table:
407 # 更新X轴校准点数据
408 self.sync_calibration_data_from_table(self.x_calibration_table,
409 self.image_viewer.x_calibration_points)
410 self.status_bar.showMessage("X轴校准数据已更新")
411 elif table == self.y_calibration_table:
412 # 更新Y轴校准点数据
413 self.sync_calibration_data_from_table(self.y_calibration_table,
414 self.image_viewer.y_calibration_points)
415 self.status_bar.showMessage("Y轴校准数据已更新")
416
417 # 校准数据变化后,更新曲线点表格中的转换坐标
418 self.image_viewer.update_curve_table()
419
420 except ValueError:
421 # 如果输入的不是有效的数字,恢复原值
422 self.status_bar.showMessage("校准数据输入无效,请输入正确的数字")
423 # 重新加载表格数据以恢复原值
424 if table == self.x_calibration_table:
425 self.update_x_calibration_table()
426 else:
427 self.update_y_calibration_table()
428
429 def sync_calibration_data_from_table(self, table_widget, calibration_points):
430 """
431 从表格同步校准数据到内存中的校准点列表
432
433 Args:
434 table_widget: 校准表格控件
435 calibration_points: 要更新的校准点数据列表
436 """
437 calibration_points.clear()
438 for row in range(table_widget.rowCount()):
439 pixel_item = table_widget.item(row, 0)
440 actual_item = table_widget.item(row, 1)
441 if pixel_item and actual_item:
442 try:
443 pixel_val = int(pixel_item.text())
444 actual_val = float(actual_item.text())
445 calibration_points.append((pixel_val, actual_val))
446 except ValueError:
447 # 跳过无效的条目
448 continue
449
450 def create_curve_group(self):
451 """Create curve points group"""
452 curve_group = QGroupBox("曲线点数据")
453 curve_layout = QVBoxLayout()
454 curve_layout.setContentsMargins(10, 15, 10, 10)
455 curve_layout.setSpacing(8)
456
457 # Create table for curve points - 优化表格高度,充分利用右侧空间
458 self.curve_table = QTableWidget()
459 self.curve_table.setColumnCount(4)
460 self.curve_table.setHorizontalHeaderLabels(
461 ["像素X", "像素Y", "转换X", "转换Y"])
462 self.curve_table.horizontalHeader().setSectionResizeMode(QHeaderView.Stretch)
463
464 # 设置表格高度,充分利用右侧空间
465 self.curve_table.setMinimumHeight(400)
466 self.curve_table.setSizeAdjustPolicy(QTableWidget.AdjustToContents)
467 self.curve_table.setVerticalScrollBarPolicy(Qt.ScrollBarAsNeeded)
468 self.curve_table.setHorizontalScrollBarPolicy(Qt.ScrollBarAlwaysOff)
469
470 # 优化表格样式,确保良好的可读性
471 self.curve_table.setStyleSheet("""
472 QTableWidget {
473 border: 1px solid #dee2e6;
474 background-color: white;
475 selection-background-color: #0078d4;
476 selection-color: white;
477 gridline-color: #e0e0e0;
478 font-size: 9pt;
479 alternate-background-color: #f8f9fa;
480 }
481 QTableWidget::item {
482 padding: 4px 6px;
483 border-bottom: 1px solid #e0e0e0;
484 min-height: 22px;
485 }
486 QTableWidget::item:selected {
487 background-color: #0078d4;
488 color: white;
489 }
490 QHeaderView::section {
491 background-color: #f5f5f5;
492 color: #333333;
493 padding: 6px 4px;
494 border: 1px solid #dee2e6;
495 font-size: 9pt;
496 min-height: 26px;
497 font-weight: normal;
498 }
499 QScrollBar:vertical {
500 width: 12px;
501 background-color: #f8f9fa;
502 border: 1px solid #dee2e6;
503 }
504 QScrollBar::handle:vertical {
505 background-color: #c0c0c0;
506 border-radius: 4px;
507 min-height: 20px;
508 }
509 QScrollBar::handle:vertical:hover {
510 background-color: #a0a0a0;
511 }
512 """)
513
514 # 启用交替行颜色以提高可读性
515 self.curve_table.setAlternatingRowColors(True)
516
517 curve_layout.addWidget(self.curve_table)
518
519 # 表格控制按钮 - 优化布局确保不与表格重叠
520 table_btn_layout = QHBoxLayout()
521 table_btn_layout.setContentsMargins(0, 8, 0, 0) # 增加上边距
522 table_btn_layout.setSpacing(8)
523
524 self.delete_point_btn = QPushButton("删除选中点")
525 self.delete_point_btn.clicked.connect(self.delete_selected_point)
526 table_btn_layout.addWidget(self.delete_point_btn)
527
528 self.move_up_btn = QPushButton("上移")
529 self.move_up_btn.clicked.connect(self.move_point_up)
530 table_btn_layout.addWidget(self.move_up_btn)
531
532 self.move_down_btn = QPushButton("下移")
533 self.move_down_btn.clicked.connect(self.move_point_down)
534 table_btn_layout.addWidget(self.move_down_btn)
535
536 # 添加弹性空间确保按钮左对齐
537 table_btn_layout.addStretch()
538
539 curve_layout.addLayout(table_btn_layout)
540 curve_group.setLayout(curve_layout)
541 return curve_group
542
543 def load_image(self):
544 """Load image from file dialog"""
545 file_path, _ = QFileDialog.getOpenFileName(
546 self, "选择图片", "", "图片文件 (*.png *.jpg *.jpeg *.bmp)"
547 )
548 if file_path:
549 self.image_viewer.load_image(file_path)
550
551 def set_mode(self, mode):
552 """Set the interaction mode"""
553 self.image_viewer.set_mode(mode)
554
555 # 更新菜单项文本来表示当前模式
556 self.x_axis_action.setText("X轴校准(&X)")
557 self.y_axis_action.setText("Y轴校准(&Y)")
558 self.curve_action.setText("曲线提取(&C)")
559
560 # 重置所有工具栏按钮的选中状态
561 self.x_axis_toolbar_action.setChecked(False)
562 self.y_axis_toolbar_action.setChecked(False)
563 self.curve_toolbar_action.setChecked(False)
564
565 # 重置工具栏按钮工具提示
566 self.x_axis_toolbar_action.setToolTip("X轴校准模式")
567 self.y_axis_toolbar_action.setToolTip("Y轴校准模式")
568 self.curve_toolbar_action.setToolTip("曲线提取模式")
569
570 # 根据当前模式设置菜单项和工具栏按钮状态
571 if mode == "x_axis":
572 self.x_axis_action.setText("● X轴校准(&X)")
573 self.x_axis_toolbar_action.setChecked(True)
574 self.x_axis_toolbar_action.setToolTip("● X轴校准模式 (当前激活)")
575 elif mode == "y_axis":
576 self.y_axis_action.setText("● Y轴校准(&Y)")
577 self.y_axis_toolbar_action.setChecked(True)
578 self.y_axis_toolbar_action.setToolTip("● Y轴校准模式 (当前激活)")
579 elif mode == "curve":
580 self.curve_action.setText("● 曲线提取(&C)")
581 self.curve_toolbar_action.setChecked(True)
582 self.curve_toolbar_action.setToolTip("● 曲线提取模式 (当前激活)")
583
584 def clear_points(self):
585 """Clear all points"""
586 self.image_viewer.clear_points()
587 self.x_calibration_table.setRowCount(0)
588 self.y_calibration_table.setRowCount(0)
589 self.curve_table.setRowCount(0) # 同时清除曲线表格显示
590 # 在状态栏显示清除结果
591 self.status_bar.showMessage("所有点已清除")
592
593 def get_calibration_data(self, table_widget):
594 """Extract calibration data from table widget"""
595 calibration = []
596 for row in range(table_widget.rowCount()):
597 pixel_item = table_widget.item(row, 0)
598 actual_item = table_widget.item(row, 1)
599 if pixel_item and actual_item:
600 try:
601 pixel_val = int(pixel_item.text())
602 actual_val = float(actual_item.text())
603 calibration.append((pixel_val, actual_val))
604 except ValueError:
605 pass # Ignore invalid entries
606 return calibration
607
608 def update_calibration_table(self, table_widget, calibration_points):
609 """Update calibration table from data"""
610 # 临时断开信号连接,避免在更新表格时触发itemChanged信号
611 try:
612 table_widget.itemChanged.disconnect(
613 self.on_calibration_table_changed)
614 except TypeError:
615 # 如果信号没有连接,忽略错误
616 pass
617
618 table_widget.setRowCount(len(calibration_points))
619 for i, (pixel_val, actual_val) in enumerate(calibration_points):
620 table_widget.setItem(i, 0, QTableWidgetItem(str(pixel_val)))
621 table_widget.setItem(i, 1, QTableWidgetItem(str(actual_val)))
622
623 # 重新连接信号
624 table_widget.itemChanged.connect(self.on_calibration_table_changed)
625
626 def update_x_calibration_table(self):
627 """Update X calibration table from image viewer data"""
628 self.update_calibration_table(
629 self.x_calibration_table, self.image_viewer.x_calibration_points)
630 # 校准点变化后,同时更新曲线点表格中的转换坐标
631 self.image_viewer.update_curve_table()
632
633 def update_y_calibration_table(self):
634 """Update Y calibration table from image viewer data"""
635 self.update_calibration_table(
636 self.y_calibration_table, self.image_viewer.y_calibration_points)
637 # 校准点变化后,同时更新曲线点表格中的转换坐标
638 self.image_viewer.update_curve_table()
639
640 def delete_calibration_point(self, table_widget, calibration_points, point_type):
641 """
642 删除选中的校准点
643
644 Args:
645 table_widget: 校准表格控件
646 calibration_points: 校准点数据列表
647 point_type: 校准点类型(用于显示消息)
648 """
649 current_row = table_widget.currentRow()
650 if current_row >= 0 and current_row < len(calibration_points):
651 # 从数据列表中删除选中的校准点
652 del calibration_points[current_row]
653 # 更新表格显示
654 self.update_calibration_table(table_widget, calibration_points)
655 # 校准点删除后,同时更新曲线点表格中的转换坐标
656 self.image_viewer.update_curve_table()
657 self.status_bar.showMessage(
658 f"已删除{point_type}校准点 {current_row + 1}")
659
660 def delete_selected_x_calibration(self):
661 """删除选中的X轴校准点"""
662 self.delete_calibration_point(
663 self.x_calibration_table, self.image_viewer.x_calibration_points, "X轴")
664
665 def delete_selected_y_calibration(self):
666 """删除选中的Y轴校准点"""
667 self.delete_calibration_point(
668 self.y_calibration_table, self.image_viewer.y_calibration_points, "Y轴")
669
670 def delete_selected_point(self):
671 """删除选中的曲线点"""
672 current_row = self.curve_table.currentRow()
673 if current_row >= 0 and current_row < len(self.image_viewer.curve_points):
674 del self.image_viewer.curve_points[current_row]
675 self.image_viewer.update_curve_table()
676 self.status_bar.showMessage(f"已删除曲线点 {current_row + 1}")
677
678 def move_point_up(self):
679 """将选中的曲线点上移一位"""
680 current_row = self.curve_table.currentRow()
681 if current_row > 0 and current_row < len(self.image_viewer.curve_points):
682 # 与上一个点交换位置
683 points = self.image_viewer.curve_points
684 points[current_row], points[current_row - 1] = \
685 points[current_row - 1], points[current_row]
686 self.image_viewer.update_curve_table()
687 # 保持选中状态在移动后的位置
688 self.curve_table.setCurrentCell(current_row - 1, 0)
689
690 def move_point_down(self):
691 """将选中的曲线点下移一位"""
692 current_row = self.curve_table.currentRow()
693 if current_row >= 0 and current_row < len(self.image_viewer.curve_points) - 1:
694 # 与下一个点交换位置
695 points = self.image_viewer.curve_points
696 points[current_row], points[current_row + 1] = \
697 points[current_row + 1], points[current_row]
698 self.image_viewer.update_curve_table()
699 # 保持选中状态在移动后的位置
700 self.curve_table.setCurrentCell(current_row + 1, 0)
701
702 def save_csv(self):
703 """
704 保存提取的数据到CSV文件
705
706 会生成三个文件:
707 1. 主数据文件:包含所有曲线点的像素坐标和转换后的实际坐标
708 2. X轴校准文件:包含X轴的校准数据
709 3. Y轴校准文件:包含Y轴的校准数据
710 """
711 # 检查是否有曲线点数据
712 if not self.image_viewer.curve_points:
713 QMessageBox.warning(self, "警告", "没有曲线点数据")
714 return
715
716 # 获取校准数据
717 x_calibration = self.get_calibration_data(self.x_calibration_table)
718 y_calibration = self.get_calibration_data(self.y_calibration_table)
719
720 # 检查校准数据是否完整
721 if not x_calibration or not y_calibration:
722 QMessageBox.warning(self, "警告", "请完成X轴和Y轴校准")
723 return
724
725 # 使用校准数据转换曲线点坐标
726 transformed_points = self.transform_points(
727 self.image_viewer.curve_points, x_calibration, y_calibration
728 )
729
730 # 选择保存位置
731 file_path, _ = QFileDialog.getSaveFileName(
732 self, "保存CSV文件", "", "CSV文件 (*.csv)"
733 )
734
735 if file_path:
736 # 生成三个相关文件的路径
737 base_path = Path(file_path)
738 base_name = base_path.stem
739 base_dir = base_path.parent
740
741 main_file = file_path
742 x_cal_file = base_dir / f"{base_name}-X.csv"
743 y_cal_file = base_dir / f"{base_name}-Y.csv"
744
745 # 保存三个文件
746 self.save_to_csv(transformed_points, main_file)
747 self.save_calibration_csv(x_calibration, x_cal_file, "X")
748 self.save_calibration_csv(y_calibration, y_cal_file, "Y")
749
750 self.status_bar.showMessage(
751 f"成功保存数据到: {Path(main_file).name}, {Path(x_cal_file).name}, {Path(y_cal_file).name}")
752
753 def save_calibration_csv(self, calibration_data, file_path, axis_name):
754 """Save calibration data to CSV file"""
755 with open(file_path, 'w', newline='', encoding='utf-8') as csvfile:
756 writer = csv.writer(csvfile)
757 writer.writerow(
758 [f'pixel_{axis_name.lower()}', f'actual_{axis_name.lower()}'])
759 for pixel_val, actual_val in calibration_data:
760 writer.writerow([pixel_val, actual_val])
761
762 def transform_points(self, curve_points, x_calibration, y_calibration):
763 """
764 使用最小二乘法将所有曲线点的像素坐标转换为实际坐标
765
766 工作原理:
767 1. 根据校准点建立像素坐标到实际坐标的线性变换关系
768 2. 使用最小二乘法拟合直线:actual = k * pixel + b
769 3. 将所有曲线点应用这个变换关系
770
771 Args:
772 curve_points: 曲线点像素坐标列表 [(pixel_x, pixel_y), ...]
773 x_calibration: X轴校准数据 [(像素值, 实际值), ...]
774 y_calibration: Y轴校准数据 [(像素值, 实际值), ...]
775
776 Returns:
777 变换后的点列表 [(pixel_x, pixel_y, actual_x, actual_y), ...]
778 """
779 # 提取校准点的像素坐标和实际坐标
780 x_pixels = [p[0] for p in x_calibration]
781 y_pixels = [p[0] for p in y_calibration]
782
783 def fit_linear_transformation(pixel_coords, actual_coords):
784 """
785 拟合线性变换关系:actual = k * pixel + b
786
787 如果校准点少于2个,返回恒等变换(不进行坐标转换)
788 """
789 if len(pixel_coords) < 2:
790 return lambda x: x # 恒等函数,不进行转换
791
792 # 构建最小二乘法的系数矩阵 A = [pixel_coords, ones]
793 # 求解方程组:A * [k, b]^T = actual_coords
794 A = np.vstack([pixel_coords, np.ones(len(pixel_coords))]).T
795 k, b = np.linalg.lstsq(A, actual_coords, rcond=None)[0]
796 return lambda x: k * x + b
797
798 # 创建X轴和Y轴的坐标变换函数
799 transform_x = fit_linear_transformation(
800 x_pixels, [p[1] for p in x_calibration])
801 transform_y = fit_linear_transformation(
802 y_pixels, [p[1] for p in y_calibration])
803
804 # 对所有曲线点应用坐标变换
805 transformed = []
806 for pixel_x, pixel_y in curve_points:
807 x_val = transform_x(pixel_x)
808 y_val = transform_y(pixel_y)
809 transformed.append((pixel_x, pixel_y, x_val, y_val))
810
811 return transformed
812
813 def save_to_csv(self, points, file_path):
814 """Save points to CSV file"""
815 with open(file_path, 'w', newline='', encoding='utf-8') as csvfile:
816 writer = csv.writer(csvfile)
817 writer.writerow(['px', 'py', 'x', 'y'])
818 for px, py, x, y in points:
819 writer.writerow([px, py, x, y])
820
821 # 在状态栏显示保存结果
822 self.status_bar.showMessage(
823 f"已保存 {len(points)} 个数据点到: {Path(file_path).name}")
一个main函数运行App应用
1def main():
2    app = QApplication(sys.argv)
3    window = CoordinateExtractorApp()
4    window.show()
5    sys.exit(app.exec())
6
7
8if __name__ == "__main__":
9    main()
AI编程
基本上这个程序,我就是写了个需求分析,然后让Claude Sonnet 4编写了大部分代码,然后我进行了测试和调试。
Claude Sonnet 4的表现非常不错,基本上能理解需求,并且能编写出符合需求的代码。虽然有些细节需要我来调整和完善,但整体上节省了大量的时间。
AI最擅长的部分:
- 编写UI布局的代码
- 调整布局,比如添加菜单栏、工具栏等
- 编写一些重复性的代码,比如继承函数接口
- 在Python中轮子非常多,调用各个库的代码在文档和example中都有,所以AI也很擅长,这就包括数据处理、IO库等
AI不擅长的部分:
- 还没发现……
我感觉已经可以做很多东西了……
文章标签
|-->python |-->GetData |-->Graph |-->Digitizer |-->数据曲线 |-->科研工具
- 本站总访问量:loading次
- 本站总访客数:loading人
- 可通过邮件联系作者:Email大福
- 也可以访问技术博客:大福是小强
- 也可以在知乎搞抽象:知乎-大福
- Comments, requests, and/or opinions go to: Github Repository