Tiledlayout_in_Matlab中的分块图布局
贴砖多图新方式
从R2019b开始,MATLAB提供了新的贴砖多图方式,可以更加方便的绘制多个子图。
这个功能由以下函数构成:
tiledlayoutnexttiletilenumtilerowcol
tiledlayout和TiledChartLayout对象
tiledlayout函数用于创建一个贴砖布局,它对应于一个TiledChartLayout对象。调用语法有以下几种。
1tiledlayout(m,n)
2tiledlayout(arrangement)
3tiledlayout(___,Name,Value)
4tiledlayout(parent,___)
5t = tiledlayout(___)
分别对应的是:
m和n:行数和列数,创建一个固定的行列布局arrangement:自动调节布局方式,可以是"flow"或"vertical","horizontal",新增加的行列数会根据子图的大小自动调整- 设置
Name-Value对,可以设置"Padding","TileSpacing","TileWidth","TileHeight"等属性 parent:指定父级对象t:返回一个TiledChartLayout对象
nexttile函数
nexttile函数用于在贴砖布局中创建下一个子图,调用语法有以下几种。
1nexttile
2nexttile(span)
3nexttile(tilelocation)
4nexttile(tilelocation,span)
5nexttile(parent_tiledlayout, ___)
6ax = nexttile(___)
这个函数在TiledChartLayout对象上调用,返回一个Axes对象。这个对应的坐标轴对象可以用于绘图,并且会被设定为当前坐标轴,a.k.a.,gca返回这个坐标系,a.k.a.,可以直接调用plot等函数进行绘图。
nexttile:在下一个位置创建一个子图nexttile(span):在下一个位置创建一个子图,占据span描述的区域,span是一个二元向量,分别表示行数和列数nexttile(tilelocation):在指定位置创建/更新一个子图,tilelocation是一个数字,表示位置(按顺序数过来)nexttile(tilelocation,span):在指定位置创建/更新一个子图,占据span描述的区域nexttile(parent_tiledlayout, ___):可以使用前面所有的语法,但是设定父级对象,一般而言,总是在图窗中查找父级对象,当把TiledChartLayout对象放在其他容器中时,需要指定父级对象ax = nexttile(___):返回之前创建的Axes对象,可以使用前面所有的语法调用
另外,有一个很没有一致性的地方,tilelocation是从左上角开始数的,行先的方式;并且还可以设定为"east","west","north","south"等方位,分别表示东西南北的网格外层的图块……此时,我的表情是……
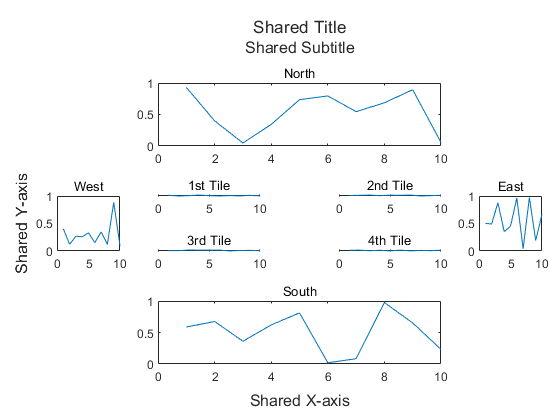
 1t = tiledlayout(2,2);
 2
 3t.Title.String = 'Shared Title';
 4t.Subtitle.String = 'Shared Subtitle';
 5t.XLabel.String = 'Shared X-axis';
 6t.YLabel.String = 'Shared Y-axis';
 7
 8nexttile
 9plot(1:10, rand(1,10));
10title('1st Tile');
11
12nexttile
13plot(1:10, rand(1,10));
14title('2nd Tile');
15
16nexttile
17plot(1:10, rand(1,10));
18title('3rd Tile');
19
20nexttile
21plot(1:10, rand(1,10));
22title('4th Tile');
23
24nexttile('east')
25plot(1:10, rand(1,10));
26title('East');
27
28nexttile('south')
29plot(1:10, rand(1,10));
30title('South');
31
32nexttile('west')
33plot(1:10, rand(1,10));
34title('West');
35
36nexttile('north')
37plot(1:10, rand(1,10));
38title('North');
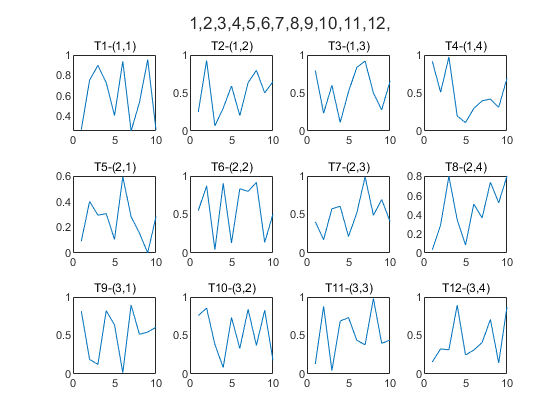
tilenum和tilerowcol函数
这两个函数就是用来获取当前的行列数和位置的转换。
 1[m, n] = deal(3, 4);
 2t = tiledlayout(m, n);
 3
 4for i = 1:tilenum(t, m, n)
 5    nexttile
 6    [row, col] = tilerowcol(t, i);
 7    plot(1:10, rand(1,10));
 8    title(['T' num2str(i), '-(', num2str(row), ',', num2str(col), ')']);
 9end
10
11
12t.Title.String = sprintf('%d,', tilenum(t, [1 1 1 1 2 2 2 2 3 3 3 3], [1 2 3 4 1 2 3 4 1 2 3 4]));
行列布局
采取tiledlayout(m,n)的方式创建一个行列布局,然后使用nexttile函数来创建子图。
与其他一般的图形中会使用字符串来设置标签不同,这里的标题(Title),副标题(Subtitle),X轴标签(XLabel),Y轴标签(YLabel)等属性都是直接设置为Text对象。而且这几个对象都是整个布局共享的。示例如下。
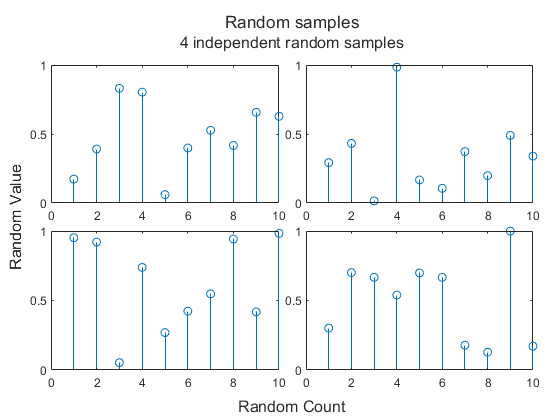
确定图形周围空白大小和图块间距的两个参数分别是:
Padding:图形周围的空白大小,'loose',compact,'tight',默认是'loose'TileSpacing:图块间距,'loose','compact','tight','none',默认是'loose'
 1t = tiledlayout(2, 2);
 2
 3t.TileSpacing = 'tight';
 4t.Padding = 'compact';
 5
 6t.Title.String = 'Random samples';
 7t.XLabel.String = 'Random Count';
 8t.YLabel.String = 'Random Value';
 9t.Subtitle.String = '4 independent random samples';
10
11nexttile
12stem(1:10, rand(1, 10));
13
14nexttile
15stem(1:10, rand(1, 10));
16
17nexttile
18stem(1:10, rand(1, 10));
19
20nexttile
21stem(1:10, rand(1, 10));
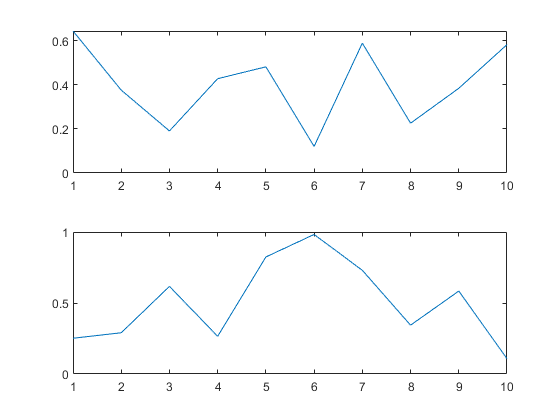
流式、单行、单列布局
采用tiledlayout("arrangement")的方式创建一个流式布局,然后使用nexttile函数来创建子图。这里的"arrangement"可以是"flow","vertical","horizontal",新增加的行列数会根据子图的大小自动调整。
注意,在这种情况下,可以采用命令的方式来调用:
1tiledlayout flow
2
3nexttile
4plot(1:10, rand(1, 10));
增加一个新的图。
1tiledlayout flow
2
3nexttile
4plot(1:10, rand(1, 10));
5
6nexttile
7plot(1:10, rand(1, 10));
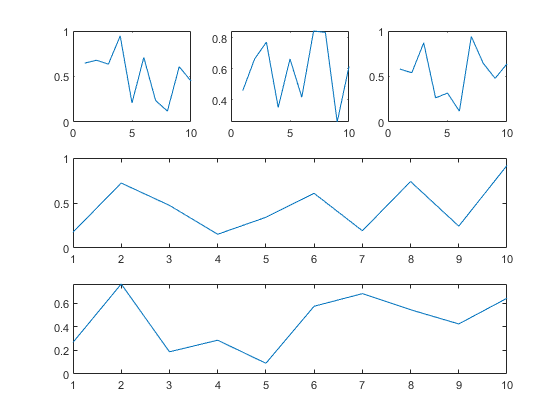
再增加一个新的图。
 1tiledlayout flow
 2
 3nexttile
 4plot(1:10, rand(1, 10));
 5
 6nexttile
 7plot(1:10, rand(1, 10));
 8
 9nexttile
10plot(1:10, rand(1, 10));
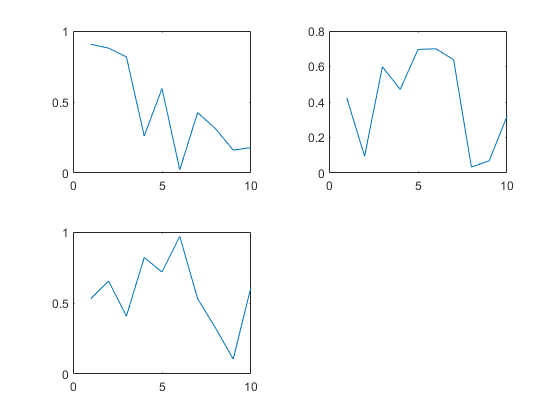
观察这里的布局方式,流式布局总是试图维持大概的长宽比例来适应子图的大小。
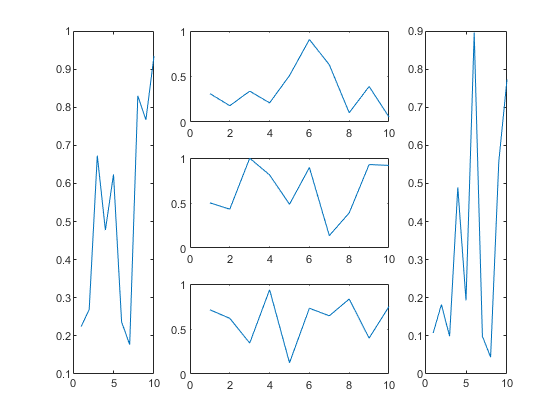
相应的,垂直布局和水平布局也很好理解。
下面试试,行列布局的嵌套。
 1t = tiledlayout('vertical');
 2
 3t2 = tiledlayout(t, 'horizontal');
 4
 5nexttile(t)
 6plot(1:10, rand(1, 10));
 7
 8nexttile(t)
 9plot(1:10, rand(1, 10));
10
11nexttile(t2)
12plot(1:10, rand(1, 10));
13
14nexttile(t2)
15plot(1:10, rand(1, 10));
16
17nexttile(t2)
18plot(1:10, rand(1, 10));
或者是这样嵌套。
这里建立一个嵌套的列之后,显式地指定了在父布局中的位置。
其中Layout.Tile属性指定了位置,第二个位置;Layout.TileSpan则指定了相应区域大小,也就是这里的两列。
最终结果是这样的。
 1t = tiledlayout('horizontal');
 2
 3nexttile(t)
 4
 5plot(1:10, rand(1, 10));
 6
 7t2 = tiledlayout(t, 'vertical');
 8t2.Layout.Tile = 2;
 9t2.Layout.TileSpan = [1 2];
10
11nexttile(t)
12plot(1:10, rand(1, 10));
13
14nexttile(t2)
15plot(1:10, rand(1, 10));
16
17nexttile(t2)
18plot(1:10, rand(1, 10));
19
20nexttile(t2)
21plot(1:10, rand(1, 10));
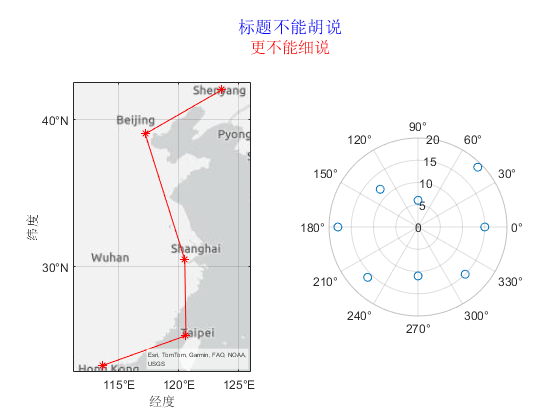
地理图+极坐标系
可以看到,nexttile只是占了一个位置,实际的坐标系是可以自由设置的。
下面给出一个地理图和极坐标系的例子。
 1titleX = matlab.graphics.layout.Text(String="标题不能胡说",Color='blue');
 2subtitleX = matlab.graphics.layout.Text(String="更不能细说",Color='red');
 3
 4
 5tiledlayout(1,2, Title=titleX, Subtitle=subtitleX);
 6
 7% Display geographic plot
 8nexttile
 9geoplot([22.6 24.9 30.5 39.1 41.9],[113.6  120.6 120.5 117.2 123.6],'r-*')
10
11% Display polar plot
12nexttile
13theta = pi/4:pi/4:2*pi;
14rho = [19 6 12 18 16 11 15 15];
15polarscatter(theta,rho)
总结
这个方式比之前的subplot函数更加灵活,可以更加方便的绘制多个子图。但是,这个功能在R2019b之后才有,所以需要注意版本的问题。
文章标签
|-->matlab |-->tiledlayout |-->tutorial |-->figure |-->subplot
- 本站总访问量:loading次
- 本站总访客数:loading人
- 可通过邮件联系作者:Email大福
- 也可以访问技术博客:大福是小强
- 也可以在知乎搞抽象:知乎-大福
- Comments, requests, and/or opinions go to: Github Repository