<-- Home
|--matlab

心脏线与圆滚线的Matlab App
心脏线
心脏线是一种特殊的曲线,因其形状类似心脏而得名。
心脏线的数学定义
心脏线有几种等价的数学定义:
极坐标定义
心脏线在极坐标系中最常见的表达式为:
$$ r = a(1 + \cos\theta) $$或者等价形式:
$$ r = a(1 - \cos\theta) $$其中 $a$ 是一个正常数,表示曲线的大小。
参数方程定义
心脏线也可以用参数方程表示:
$$ \begin{aligned} x &= a(2\cos t - \cos 2t) \\ y &= a(2\sin t - \sin 2t) \end{aligned} $$其中 $t$ 是参数,取值范围为 $0 \leq t \leq 2\pi$。
几何定义
从几何上看,心脏线是一个圆在平面上绕另一个圆滚动时,圆上一点所形成的轨迹。两个圆的半径相等,圆心距离为两个圆半径之和。
心脏线的性质
- 心脏线是一个闭合曲线
- 在极点处有一个尖点(cusp)
- 曲线的周长为 $8a$
- 曲线所围面积为 $\frac{3\pi a^2}{2}$
心脏线在数学和物理中有许多应用,包括光学中的反射和折射现象,以及计算机图形学中的曲线设计。
当两个圆的半径取不同值时,可能形成不同的形状(例如肾脏线)。
APP实现
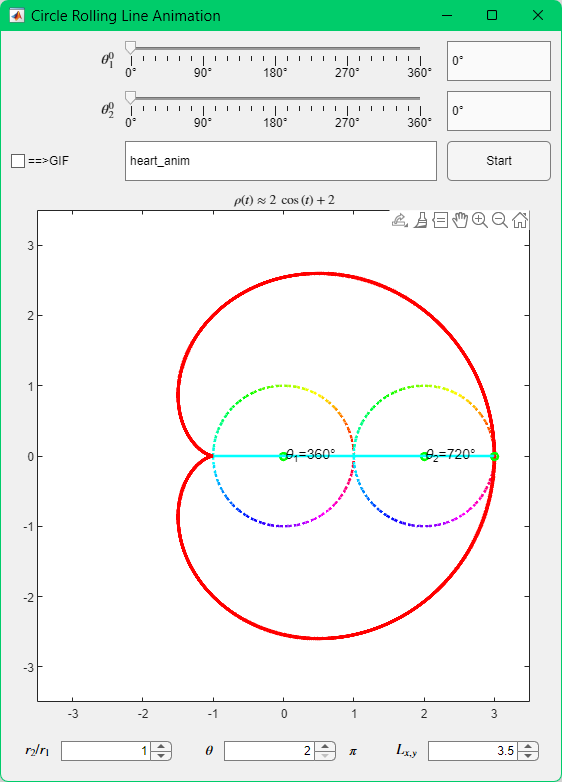
我们按照圆滚线的几何定义,实现一个GUI程序,用于绘制各种圆滚线。
GUI代码
这个GUI的界面设计和GUI的代码都相当的随意和愚蠢,用一个$5 \times 3$的网格布局,把各个用户输入和动画输出随意放置。一个按钮在启动动画,启动时获取各个输入控件的值,然后调用heartAnim.m中的函数,绘制动画。
  1function fig = heartAnim
  2fig = uifigure("Name", "Circle Rolling Line Animation");
  3fig.Visible = 'off';
  4fig.Position(3:4) = [560, 750];
  5movegui(fig, 'center');
  6
  7
  8layout = uigridlayout(fig, [5, 3]);
  9layout.RowHeight = {40, 40, 40, '1x', 40};
 10layout.ColumnWidth = {'1x', '3x', '1x'};
 11
 12ax = uiaxes(layout);
 13ax.Layout.Row = 4;
 14ax.Layout.Column = [1, 3];
 15
 16% UI controls
 17t1_label = uilabel(layout);
 18t1_label.Text = "$\theta_1^0$";
 19t1_label.Interpreter = 'latex';
 20t1_label.Layout.Row = 1;
 21t1_label.Layout.Column = 1;
 22% right aligned
 23t1_label.HorizontalAlignment = 'right';
 24
 25slider = uislider(layout);
 26slider.Limits = [0, 2*pi];
 27slider.Value = 0;
 28slider.Layout.Row = 1;
 29slider.Layout.Column = 2;
 30% make it n * pi
 31slider.MajorTicks = 0:pi/2:2*pi;
 32slider.MajorTickLabels = {'0°', '90°', '180°', '270°', '360°'};
 33slider.MinorTicks = 0:pi/12:2*pi;
 34
 35t1_value = uieditfield(layout);
 36t1_value.Layout.Row = 1;
 37t1_value.Layout.Column = 3;
 38t1_value.Value = "0°";
 39t1_value.Editable = false;
 40
 41slider.ValueChangedFcn = @(~, ~) updateTheta(slider, t1_value);
 42
 43t2_label = uilabel(layout);
 44t2_label.Text = "$\theta_2^0$";
 45t2_label.Interpreter = 'latex';
 46t2_label.Layout.Row = 2;
 47t2_label.Layout.Column = 1;
 48t2_label.HorizontalAlignment = 'right';
 49
 50slider2 = uislider(layout);
 51slider2.Limits = [0, 2*pi];
 52slider2.Value = 0;
 53slider2.Layout.Row = 2;
 54slider2.Layout.Column = 2;
 55% make it n * pi
 56slider2.MajorTicks = 0:pi/2:2*pi;
 57slider2.MajorTickLabels = {'0°', '90°', '180°', '270°', '360°'};
 58slider2.MinorTicks = 0:pi/12:2*pi;
 59
 60t2_value = uieditfield(layout);
 61t2_value.Layout.Row = 2;
 62t2_value.Layout.Column = 3;
 63t2_value.Value = "0°";
 64t2_value.Editable = false;
 65
 66slider2.ValueChangedFcn = @(~, ~) updateTheta(slider2, t2_value);
 67
 68checkboxOutput = uicheckbox(layout);
 69checkboxOutput.Text = "==>GIF";
 70checkboxOutput.Layout.Row = 3;
 71checkboxOutput.Layout.Column = 1;
 72checkboxOutput.Value = false;
 73
 74outputFileName = uieditfield(layout);
 75outputFileName.Layout.Row = 3;
 76outputFileName.Layout.Column = 2;
 77outputFileName.Value = "heart_anim";
 78
 79startButton = uibutton(layout);
 80startButton.Text = "Start";
 81startButton.Layout.Row = 3;
 82startButton.Layout.Column = 3;
 83
 84setupGrid = uigridlayout(layout, [1, 7]);
 85setupGrid.Layout.Row = 5;
 86setupGrid.Layout.Column = [1, 3];
 87setupGrid.ColumnWidth = {30, '1x', 30, '1x', 30, 30, '1x'};
 88
 89
 90
 91r2RatioLabel = uilabel(setupGrid);
 92r2RatioLabel.Text = "$r_2/r_1$";
 93r2RatioLabel.Interpreter = 'latex';
 94r2RatioLabel.Layout.Row = 1;
 95r2RatioLabel.Layout.Column = 1;
 96r2RatioLabel.HorizontalAlignment = 'right';
 97
 98r2RatioSpinner = uispinner(setupGrid);
 99r2RatioSpinner.Limits = [0.1, 2.0];
100r2RatioSpinner.Value = 1.0;
101r2RatioSpinner.Step = 0.05;
102r2RatioSpinner.Layout.Row = 1;
103r2RatioSpinner.Layout.Column = 2;
104
105nPiLabel = uilabel(setupGrid);
106nPiLabel.Text = "$\theta$";
107nPiLabel.Interpreter = 'latex';
108nPiLabel.Layout.Row = 1;
109nPiLabel.Layout.Column = 3;
110nPiLabel.HorizontalAlignment = 'right';
111
112nPiSpiner = uispinner(setupGrid);
113nPiSpiner.Limits = [2, 20];
114nPiSpiner.Value = 2.0;
115nPiSpiner.Step = 1.0;
116nPiSpiner.Layout.Row = 1;
117nPiSpiner.Layout.Column = 4;
118
119piLabel = uilabel(setupGrid);
120piLabel.Text = "$\pi$";
121piLabel.Interpreter = 'latex';
122piLabel.Layout.Row = 1;
123piLabel.Layout.Column = 5;
124piLabel.HorizontalAlignment = 'left';
125
126axesBoundLabel = uilabel(setupGrid);
127axesBoundLabel.Text = "$L_{x,y}$";
128axesBoundLabel.Interpreter = 'latex';
129axesBoundLabel.Layout.Row = 1;
130axesBoundLabel.Layout.Column = 6;
131axesBoundLabel.HorizontalAlignment = 'right';
132
133axesBoundSpinner = uispinner(setupGrid);
134axesBoundSpinner.Limits = [2, 10];
135axesBoundSpinner.Value = 3.5;
136axesBoundSpinner.Step = 0.5;
137axesBoundSpinner.Layout.Row = 1;
138axesBoundSpinner.Layout.Column = 7;
139
140axesBoundSpinner.ValueChangedFcn = @(~, ~) setupLim(ax, axesBoundSpinner.Value);
141
142% x = linspace(-2, 2, 1000);
143% y = sqrt(1 - x.^2) + sqrt(abs(x));
144% line(ax, x, y, 'Color', 'r', 'LineWidth', 2);
145xlim(ax, [-axesBoundSpinner.Value, axesBoundSpinner.Value]);
146ylim(ax, [-axesBoundSpinner.Value, axesBoundSpinner.Value]);
147box(ax, 'on')
148axis(ax, 'equal')
149axis(ax, 'tight')
150title(ax, "Rolling Animation")
151
152
153startButton.ButtonPushedFcn = @(~, ~) heartAnimPlot(ax, ...
154    slider.Value, slider2.Value, ...
155    checkboxOutput.Value, outputFileName.Value, ...
156    startButton, axesBoundSpinner.Value, ...
157    r2RatioSpinner.Value, nPiSpiner.Value ...
158    );
159
160
161fig.Visible = 'on';
162end
辅助函数
这个函数用于设置坐标系的范围。
1function setupLim(ax, lim)
2xlim(ax, [-lim, lim]);
3ylim(ax, [-lim, lim]);
4end
这个函数用于在设置滚动点的滑块运动时,更新对应的角度值,相应的调用函数在heartAnim.m中的第41和66行。
1function updateTheta(slider, editField)
2angle = rad2deg(slider.Value);
3editField.Value = sprintf("%.0f°", angle);
4end
绘制动画的函数是整个程序的核心,
 1function heartAnimPlot(ax, theta10, theta20, toGif, gifName, btn, axesBound, r2Ratio, nPi)
 2
 3btn.Enable = 'off';
 4cla(ax);
 5xlim(ax, [-axesBound, axesBound]);
 6ylim(ax, [-axesBound, axesBound]);
 7axis(ax, "tight")
 8axis(ax, 'equal')
 9box(ax, "on")
10axis(ax, "on")
11r1 = 1;
12r2 = r2Ratio * r1;
13% nPi = 8.0;
14
15t1 = @(dt)theta10 + dt;
16t2 = @(r1, r2, dt)theta20 + (r1+r2)/r2 * dt;
17
18dts = linspace(0, nPi * pi, 10000);
19
20theta1 = t1(dts);
21theta2 = t2(r1, r2, dts);
22heartx = (r1+r2) * cos(theta1) + r2 * cos(theta2);
23hearty = (r1+r2) * sin(theta1) + r2 * sin(theta2);
24
25% calculate gifname based on theta10 and theta20
26gifName = sprintf("%s_%.0f_%.0f.gif", gifName, rad2deg(theta10), rad2deg(theta20));
27
28dtt = (theta1 - theta2) / pi;
29while any(dtt >= 2)
30    dtt(dtt >= 2) = dtt(dtt >= 2) - 2;
31end
32while any(dtt <= 0)
33    dtt(dtt <= 0) = dtt(dtt <= 0) + 2;
34end
35
36[~, idx] = min(abs(dtt-1));
37
38heartx0 = (r1+r2) * cos(theta1(idx)) + r2 * cos(theta2(idx));
39hearty0 = (r1+r2) * sin(theta1(idx)) + r2 * sin(theta2(idx));
40try
41    heartLineLatexString = heartLineLatex(theta10, theta20, heartx0, hearty0, r1, r2);
42    ax.Title.String = sprintf("$\\rho(t)\\approx %s$", heartLineLatexString);
43    ax.Title.Interpreter = 'latex';
44catch
45    % disp(ex)
46end
47
48dts = linspace(0, nPi * pi, 50);
49
50for dti = 1:length(dts)
51    dt = dts(dti);
52    cla(ax);
53    hold(ax, 'on');
54
55    theta1 = t1(dt);
56    theta2 = t2(r1, r2, dt);
57    [~, ~] = circle(ax, 0, 0, r1, theta1, true);
58    c2x = (r1+r2) * cos(theta1);
59    c2y = (r1+r2) * sin(theta1);
60    [px, py] = circle(ax, c2x, c2y, r2, theta2, true, theta2);
61    plot(ax, heartx, hearty, 'r', 'LineWidth', 3)
62    plot(ax, [0, c2x, px], [0, c2y, py], 'g', 'Marker', 'o', 'MarkerSize', 5, 'LineWidth', 2)
63
64    plot(ax, [heartx0, px], [hearty0, py], 'c', 'LineWidth', 2)
65
66    text(ax, c2x, c2y, sprintf('\\theta_{2}=%.0f°',  rad2deg(theta2)), 'FontSize', 14)
67    text(ax, 0, 0, sprintf('\\theta_{1}=%.0f°', rad2deg(theta1)), 'FontSize', 14)
68    xlim(ax, [-axesBound, axesBound]);
69    ylim(ax, [-axesBound, axesBound]);
70    drawnow
71
72    if toGif
73        if dti == 1
74            append = false;
75        else
76            append = true;
77        end
78        exportgraphics(ax, gifName, 'Append', append);
79    end
80end
81btn.Enable = 'on';
82
83end
这个函数根据输入的滚线参数,产生10000个点的位置,然后绘制动画。
这其中调用了一个在坐标系中绘制圆的函数,
 1function [px, py] = circle(ax, x, y, r, tp, show_circle, start_theta)
 2if nargin < 5
 3    tp = [];
 4end
 5if nargin < 6
 6    show_circle = false;
 7end
 8if nargin < 7
 9    start_theta = 0;
10end
11% CIRCLE draw a circle on a plot
12% CIRCLE(ax, x, y, r) draws a circle with center at (x, y) and radius r on
13% highlit point with theta tp
14n = 20;
15k = 50;
16t = linspace(0, 2*pi, k * n) + start_theta;
17hs = ishold(ax);
18
19hold(ax, 'on');
20
21if show_circle
22    % plot(ax, x + r*cos(t), y + r*sin(t), ck);
23    % split the circle into 4 parts, and draw each part with different color
24    colors = hsv(k);
25    for i = 1:k
26        idx = (i-1)*n+1:i*n;
27        plot(ax, x + r*cos(t(idx)), y + r*sin(t(idx)),...
28            'LineWidth', 2, ...
29            'LineStyle',':', ...
30            'Color', colors(i, :));
31        % hline.Color(:) = hline.Color(:) * (i-1) / k;
32        % hline.Color = colors(i, :);
33    end
34end
35if isnumeric(tp)
36    px = x + r*cos(tp);
37    py = y + r*sin(tp);
38    plot(ax, px, py, 'r.', 'MarkerSize', 5);
39end
40if ~hs
41    hold(ax, 'off');
42end
43end
另外一个稍微好玩一点的函数,就是推导一个圆滚线的近似方程,并输出位Latex字符串,设置坐标系的标题。结果非常近似,对于心脏线,近似方程还是有点点靠谱,其它的看看就好……
 1function heartLineLatexString = heartLineLatex(theta10, theta20, hx0, hy0, r1, r2)
 2t = sym('t');
 3theta1 = t + theta10;
 4theta2 = (r1+r2)/ r2 * t + theta20;
 5heartx = (r1+r2) * cos(theta1) + r2 * cos(theta2);
 6hearty = (r1+r2) * sin(theta1) + r2 * sin(theta2);
 7rho = expand((heartx - hx0)^2 + (hearty - hy0)^2);
 8old = digits(2);
 9rho = simplify(rho);
10rho = vpa(mapSymType(rho, 'vpareal', @(x)piecewise(abs(x)<=1e-6, 0, x)), 2);
11rho = mapSymType(rho, 'vpareal', @(x)sym(round(x)));
12rho = simplify(sqrt(rho),  'IgnoreAnalyticConstraints',1);
13heartLineLatexString = latex(rho);
14digits(old);
15end
完整代码
抽象滚线
最后还有一些很抽象的玩意:
文章标签
|-->matlab |-->app |-->heartline |-->圆滚线
- 本站总访问量:loading次
- 本站总访客数:loading人
- 可通过邮件联系作者:Email大福
- 也可以访问技术博客:大福是小强
- 也可以在知乎搞抽象:知乎-大福
- Comments, requests, and/or opinions go to: Github Repository