Proper Orthogonal Decomposition #
基本原理 #
POD(Proper Orthogonal Decomposition)是一种数据矩阵分解方法, 这种分解方式也称为奇异值分解(Singular Value Decomposition,SVD)。
数据矩阵$D$的POD分解可以表示为:
$$ D = U \Sigma V^T $$SVD分解的特性是,两个矩阵$U$和$V$是即是正交矩阵,也是归一化的矩阵。 因此有:
$$ U^T U = I, \quad U U^T = I $$ $$ V^T V = I, \quad V V^T = I $$SVD分解中的$\Sigma$是一个对角矩阵,对角线上的元素为$\sigma_i$。
一旦完成矩阵的SVD分解,就可以得到矩阵$D$的拟合矩阵:
$$ D \approx \widetilde {D}_\tau = A_1 \sigma_1 + A_2 \sigma_2 + \cdots + A_\tau \sigma_\tau $$通过将分解模态带入拟合矩阵,可以得到拟合矩阵的模态:
$$ A_i = U(:, i) \cdot V(:, i)^T $$从这里我们可以看出,$A_i$是一个秩为1的矩阵,因此$A_i$的物理含义是, 矩阵$D$的第$i$个模态。
而且,数据矩阵的拟合矩阵还可以写为矩阵运算的形式:
$$ \widetilde{D}_\tau = U(:, 1:\tau) \Sigma(1:\tau, 1:\tau) V(:, 1:\tau)^T $$Eckart-Young 定理 #
Eckart-Young 定理指出,矩阵 \(D\) 在 Frobenius 范数或谱范数意义下的最佳秩-\(k\) 近似由 \(D\) 的截断奇异值分解(SVD)给出。
证明概述 #
给定一个矩阵 \(D\) 及其 SVD:
\[ D = U \Sigma V^T \]其中 \(U\) 和 \(V\) 是正交矩阵,\(\Sigma\) 是一个对角矩阵,其奇异值满足 \(\sigma_1 \geq \sigma_2 \geq \cdots \geq \sigma_n \geq 0\)。
秩为 \(k\) 的截断 SVD 为:
\[ D_k = U_k \Sigma_k V_k^T \]其中 \(U_k\) 和 \(V_k\) 分别由 \(U\) 和 \(V\) 的前 \(k\) 列组成,\(\Sigma_k\) 是包含前 \(k\) 个奇异值的 \(k \times k\) 对角矩阵。
截断误差 #
用 \(D_k\) 近似 \(D\) 的误差为:
\[ \|D - D_k\|_F^2 = \sum_{i=k+1}^{n} \sigma_i^2 \]其中 \(\|\cdot\|_F\) 表示 Frobenius 范数。这是因为矩阵的 Frobenius 范数是其奇异值平方和的平方根。
最优性 #
Eckart-Young 定理断言 \(D_k\) 是 \(D\) 的最佳秩-\(k\) 近似,意味着对于任何秩为 \(k\) 的矩阵 \(B\):
\[ \|D - B\|_F \geq \|D - D_k\|_F \]这是因为任何其他秩-\(k\) 近似 \(B\) 可以表示为:
\[ B = U_k \Sigma_k V_k^T + E \]其中 \(E\) 是一个与 \(U_k\) 的列空间和 \(V_k\) 的行空间正交的误差矩阵。正交性确保了 \(E\) 引入的额外误差不能将 Frobenius 范数降低到截断 SVD 之下。
因此,截断 SVD 提供了最小可能的误差,从而证明了该定理。
计算与实现 #
算法 #
采用Eigen3库,可以很容易实现POD的计算。
#include <Eigen/Dense>
#include <Eigen/SVD>

MatrixXd D = MatrixXd::Random(100, 100);

SVD<MatrixXd> svd(D);

MatrixXd U = svd.matrixU();
MatrixXd V = svd.matrixV();
MatrixXd Sigma = svd.singularValues();

MatrixXd D_k = U.leftCols(k) * Sigma.topRows(k) * V.leftCols(k).transpose();
实现 #
这里我们实现了一个POD的类,并给出了一个简单的demo。
#pragma once
#include <Eigen/Dense>
#include <vector>

class POD
{
public:
    POD() = default;

    // Compute POD modes from snapshot matrix X
    // X is a matrix where each column is a snapshot
    // k is the desired rank of the approximation
    void compute(const Eigen::MatrixXd &X, int k);

    // Project data onto POD modes
    Eigen::VectorXd project(const Eigen::VectorXd &data) const;

    // Reconstruct data from modal coefficients
    Eigen::VectorXd reconstruct(const Eigen::VectorXd &coeffs) const;

    // Get temporal coefficients for all snapshots
    Eigen::MatrixXd getTemporalCoefficients() const;

    // Get POD modes
    const Eigen::MatrixXd &modes() const { return modes_; }

    // Get singular values
    const Eigen::VectorXd &singularValues() const { return singular_values_; }

    // Get temporal modes (V matrix)
    const Eigen::MatrixXd &temporalModes() const { return temporal_modes_; }

private:
    Eigen::MatrixXd modes_;           // POD spatial modes (U)
    Eigen::VectorXd singular_values_; // Singular values (Σ)
    Eigen::MatrixXd temporal_modes_;  // Temporal modes (V)
    int rank_;                        // Rank of approximation
};
classDiagram
    class POD {
        +POD()
        +void compute(Eigen::MatrixXd &X, int k)
        +Eigen::VectorXd project(Eigen::VectorXd &data) const
        +Eigen::VectorXd reconstruct(Eigen::VectorXd &coeffs) const
        +Eigen::MatrixXd getTemporalCoefficients() const
        +const Eigen::MatrixXd &modes() const
        +const Eigen::VectorXd &singularValues() const
        +const Eigen::MatrixXd &temporalModes() const
        -Eigen::MatrixXd modes_
        -Eigen::VectorXd singular_values_
        -Eigen::MatrixXd temporal_modes_
        -int rank_
    }
算例 #
这里我们产生一个虚假的流场数据,并进行POD分解。
速度场的数学表达 #
在这个示例中,我们构造了一个二维周期性流场,包含水平速度分量 $u$ 和垂直速度分量 $v$。速度场在空间和时间上都是周期性的,定义在区域 $[0,2\pi] \times [0,2\pi]$ 上。
速度场的数学表达式为:
$$ \begin{aligned} u(x,y,t) &= \sin(x)\cos(y + t) \\ v(x,y,t) &= -\cos(x)\sin(y + t) \end{aligned} $$其中:
- $(x,y)$ 是空间坐标
- $t$ 是时间
- $u$ 是水平速度分量
- $v$ 是垂直速度分量
流场特征 #
这个速度场具有以下特点:
空间周期性:
- $u$ 和 $v$ 在 $x$ 和 $y$ 方向都是 $2\pi$ 周期的
- 空间网格为 $n_x \times n_y$ (示例中取 32×32)
时间演化:
- 时间项 $t$ 通过 $y + t$ 项引入
- 总时间步数为 $n_{snapshots}$ (示例中取 50)
- 时间范围从 0 到 $2\pi$
速度场结构:
- 水平速度 $u$ 和垂直速度 $v$ 相互耦合
- 满足不可压缩流动条件 ($\nabla \cdot \mathbf{u} = 0$)
- 形成旋涡状的流动结构
数据矩阵构造 #
对于POD分析,我们将速度场数据组织成矩阵形式:
$$ \mathbf{X} = \begin{bmatrix} u(\mathbf{x}_1,t_1) & u(\mathbf{x}_1,t_2) & \cdots & u(\mathbf{x}_1,t_n) \\ \vdots & \vdots & \ddots & \vdots \\ u(\mathbf{x}_m,t_1) & u(\mathbf{x}_m,t_2) & \cdots & u(\mathbf{x}_m,t_n) \\ v(\mathbf{x}_1,t_1) & v(\mathbf{x}_1,t_2) & \cdots & v(\mathbf{x}_1,t_n) \\ \vdots & \vdots & \ddots & \vdots \\ v(\mathbf{x}_m,t_1) & v(\mathbf{x}_m,t_2) & \cdots & v(\mathbf{x}_m,t_n) \end{bmatrix} $$其中:
- 每一列代表一个时间步的快照
- 矩阵上半部分存储 $u$ 分量
- 矩阵下半部分存储 $v$ 分量
- $m = n_x \times n_y$ 是空间网格点数
- $n$ 是时间步数
这种数据组织方式保持了速度分量之间的关联,使得POD分解能够捕捉到流场中 $u$ 和 $v$ 分量的耦合特征。
// Generate a simple test dataset with both u and v components
Eigen::MatrixXd generate_test_data(int nx, int ny, int n_snapshots)
{
    // Total number of spatial points for both u and v
    int n_points = 2 * nx * ny; // multiply by 2 for u and v components
    Eigen::MatrixXd X(n_points, n_snapshots);

    for (int t = 0; t < n_snapshots; ++t)
    {
        double time = t * 2.0 * M_PI / (n_snapshots - 1);

        // Fill u component (first half of the matrix)
        for (int j = 0; j < ny; ++j)
        {
            for (int i = 0; i < nx; ++i)
            {
                double x = i * 2.0 * M_PI / (nx - 1);
                double y = j * 2.0 * M_PI / (ny - 1);
                // u velocity component
                X(i + j * nx, t) = std::sin(x) * std::cos(y + time);
            }
        }

        // Fill v component (second half of the matrix)
        for (int j = 0; j < ny; ++j)
        {
            for (int i = 0; i < nx; ++i)
            {
                double x = i * 2.0 * M_PI / (nx - 1);
                double y = j * 2.0 * M_PI / (ny - 1);
                // v velocity component
                X(nx * ny + i + j * nx, t) = -std::cos(x) * std::sin(y + time);
            }
        }
    }
    return X;
}
全部代码和结果,可以参考Github Repository。
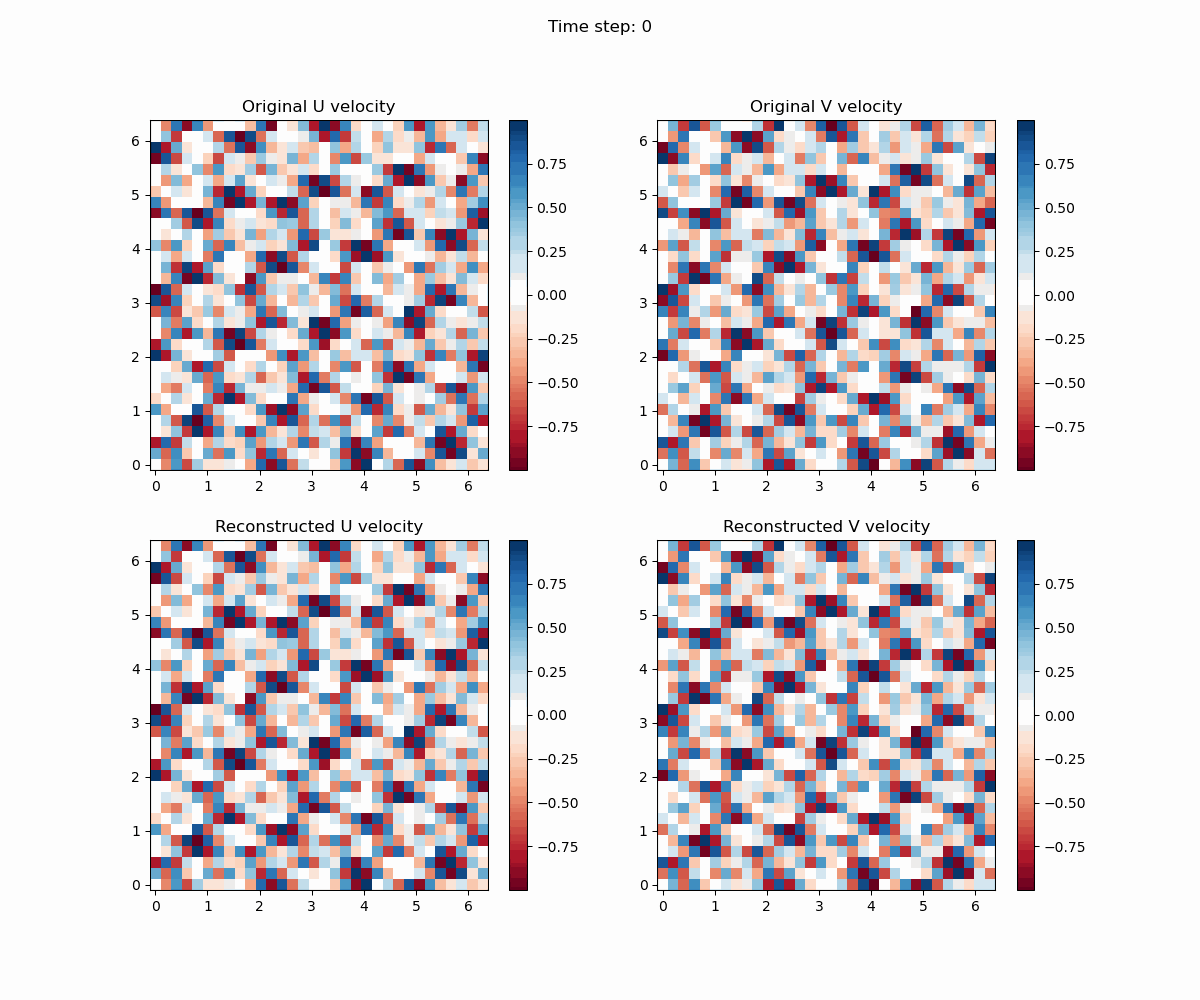
结果展示 #
通过python脚本,我们可以将结果可视化。
import numpy as np
import matplotlib.pyplot as plt
from matplotlib.animation import FuncAnimation
import struct


def read_velocity_field(filename):
    with open(filename, 'rb') as f:
        # Read dimensions
        nx = struct.unpack('i', f.read(4))[0]
        ny = struct.unpack('i', f.read(4))[0]
        n_snapshots = struct.unpack('i', f.read(4))[0]

        # Read data
        data = np.frombuffer(f.read(), dtype=np.float64)
        data = data.reshape((2*nx*ny, n_snapshots))

        return data, nx, ny, n_snapshots


def create_comparison_animation(orig_data, recon_data, nx, ny, n_snapshots, output_filename):
    # Create figure with four subplots
    fig, ((ax1, ax2), (ax3, ax4)) = plt.subplots(2, 2, figsize=(12, 10))

    # Create meshgrid for plotting
    x = np.linspace(0, 2*np.pi, nx)
    y = np.linspace(0, 2*np.pi, ny)
    X, Y = np.meshgrid(x, y)

    # Initialize plots
    # Original velocity fields
    u_orig = ax1.pcolormesh(X, Y, np.zeros((ny, nx)),
                            cmap='RdBu', shading='auto')
    v_orig = ax2.pcolormesh(X, Y, np.zeros((ny, nx)),
                            cmap='RdBu', shading='auto')

    # Reconstructed velocity fields
    u_recon = ax3.pcolormesh(X, Y, np.zeros(
        (ny, nx)), cmap='RdBu', shading='auto')
    v_recon = ax4.pcolormesh(X, Y, np.zeros(
        (ny, nx)), cmap='RdBu', shading='auto')

    # Set titles
    ax1.set_title('Original U velocity')
    ax2.set_title('Original V velocity')
    ax3.set_title('Reconstructed U velocity')
    ax4.set_title('Reconstructed V velocity')

    # Add colorbars
    plt.colorbar(u_orig, ax=ax1)
    plt.colorbar(v_orig, ax=ax2)
    plt.colorbar(u_recon, ax=ax3)
    plt.colorbar(v_recon, ax=ax4)

    def update(frame):
        # Extract original U and V components
        u_orig_frame = orig_data[:nx*ny, frame].reshape((ny, nx))
        v_orig_frame = orig_data[nx*ny:, frame].reshape((ny, nx))

        # Extract reconstructed U and V components
        u_recon_frame = recon_data[:nx*ny, frame].reshape((ny, nx))
        v_recon_frame = recon_data[nx*ny:, frame].reshape((ny, nx))

        # Update plots
        u_orig.set_array(u_orig_frame.ravel())
        v_orig.set_array(v_orig_frame.ravel())
        u_recon.set_array(u_recon_frame.ravel())
        v_recon.set_array(v_recon_frame.ravel())

        # Update color scales
        vmin_u = min(orig_data[:nx*ny, :].min(), recon_data[:nx*ny, :].min())
        vmax_u = max(orig_data[:nx*ny, :].max(), recon_data[:nx*ny, :].max())
        vmin_v = min(orig_data[nx*ny:, :].min(), recon_data[nx*ny:, :].min())
        vmax_v = max(orig_data[nx*ny:, :].max(), recon_data[nx*ny:, :].max())

        u_orig.set_clim(vmin_u, vmax_u)
        u_recon.set_clim(vmin_u, vmax_u)
        v_orig.set_clim(vmin_v, vmax_v)
        v_recon.set_clim(vmin_v, vmax_v)

        plt.suptitle(f'Time step: {frame}')
        return u_orig, v_orig, u_recon, v_recon

    # Create animation
    anim = FuncAnimation(fig, update, frames=n_snapshots,
                         interval=100, blit=True)

    # Save animation
    anim.save(output_filename, writer='pillow', fps=10)
    plt.close()


if __name__ == "__main__":
    # Read original data
    orig_data, nx, ny, n_snapshots = read_velocity_field(
        "build/velocity_field_original.bin")

    # Read reconstructed data
    recon_data, _, _, _ = read_velocity_field(
        "build/velocity_field_reconstructed.bin")

    # Create comparison animation
    create_comparison_animation(orig_data, recon_data, nx, ny, n_snapshots,
                                "doc/static/pod/velocity_field_comparison.gif")